Admins: Dashboards
The IT Audit Machine has several built-in report types designed to distill the large pool of compliance data into meaningful information across various aspects of your compliance efforts. Although each report type presents a different view of the available data, they overlap in some areas and also share some features designed to make interacting with the reports more efficient and intuitive.
In this section, we will discuss shared ITAM report features for manipulating report data, the different types of reports, and their purposes.
Creating Dashboard Reports
To start with, you can create a report by clicking on the New Report button.
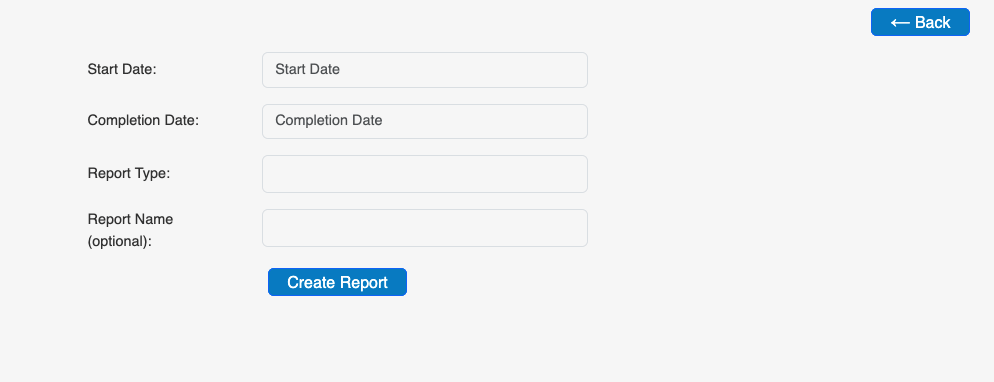
From here, you:
- Set a Start and Completion Date to cover the time span you want to track your data over. You can also set these to the same date for a single-day report, or set a future completion date to continuously expand the report as each day passes.
- Select a Report Type out of the 14 types currently available. This list is always growing, so check your handbook as new reports become available.
- Depending on the report type, you'll have the option to set other variables, such as the Entity and the forms to gather data from, the users to view, etc.
- You can also give the report a unique name for future reference.
Once finished, click the Create Report button, and the new dashboard will appear in your Dashboards list. Note that if the report covers a large volume of data, it may take some time to aggregate it.
Report Features
Several features shared across some Report Types can assist you when viewing the data in a Report.
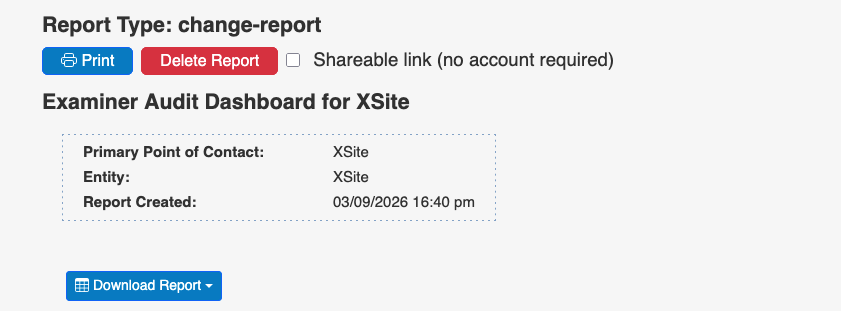
- Print: You can print a print-friendly version to your printer of choice or save it as a PDF.
- Delete Report: Remove this dashboard from your list of existing (or running) reports.
- Shareable Link: By clicking this checkbox, you can access a link to share via email or some other medium.
- Download Report: You can pull a digital copy of your report as a spreadsheet (XLSX) or a Comma-Separated Values (CSV) file.
Additionally, the header of any dashboard report contains the Point of Contact, Entity, and Creation Date and Time.
Report Header Summary
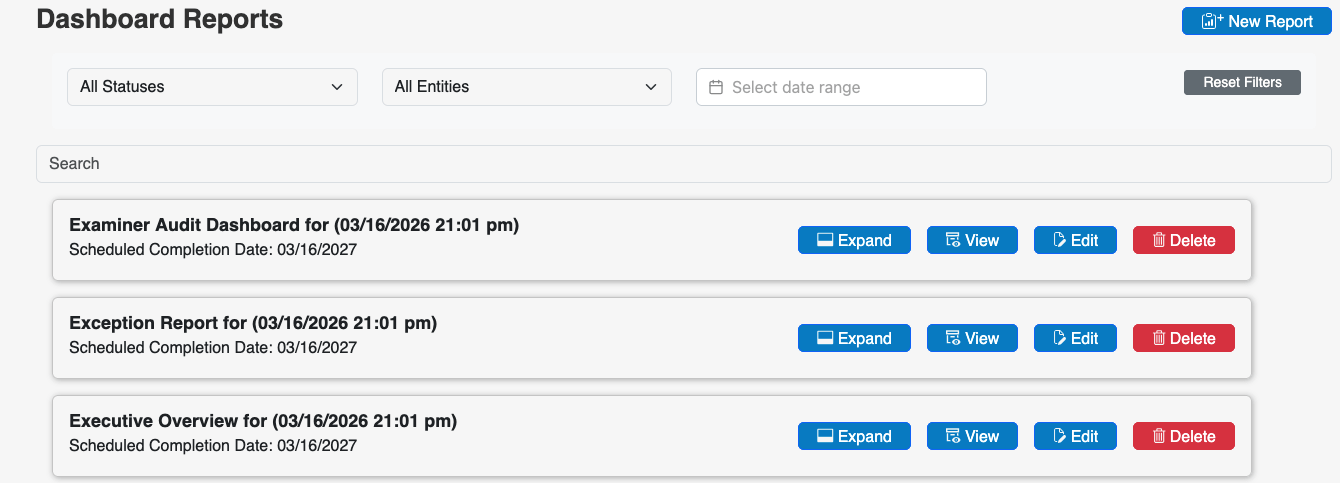
When you select a dashboard from your list, you can look at a summary of that dashboard by clicking the Expand button.
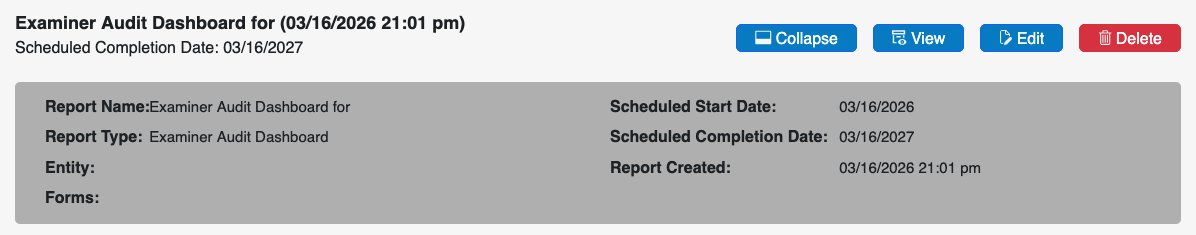
Here you can see the Report Name and Type, the Entity and Forms it is assigned to (if any), the scheduled start and end date, and the date it was created.
Report Types
There are ten types of reports provided in the IT Audit Machine. Each is designed to provide an overview of compliance and to answer everyday needs you or your auditors might have regarding the data in the forms to which your organization has been granted access. The types of reports are listed below, along with an overview of the data and insights they provide.
Audit Dashboard
The Audit Dashboard report returns details of auditable actions by both Portal and Administrative users. It is designed to allow a quick review of the actions taken, including the related timestamp, and to export the data for review outside of ITAM. There are separate views that detail actions by Administrative Users and Portal Users, respectively.
This report may determine who took a particular action in the system or show which auditable actions a user took at a specific time.
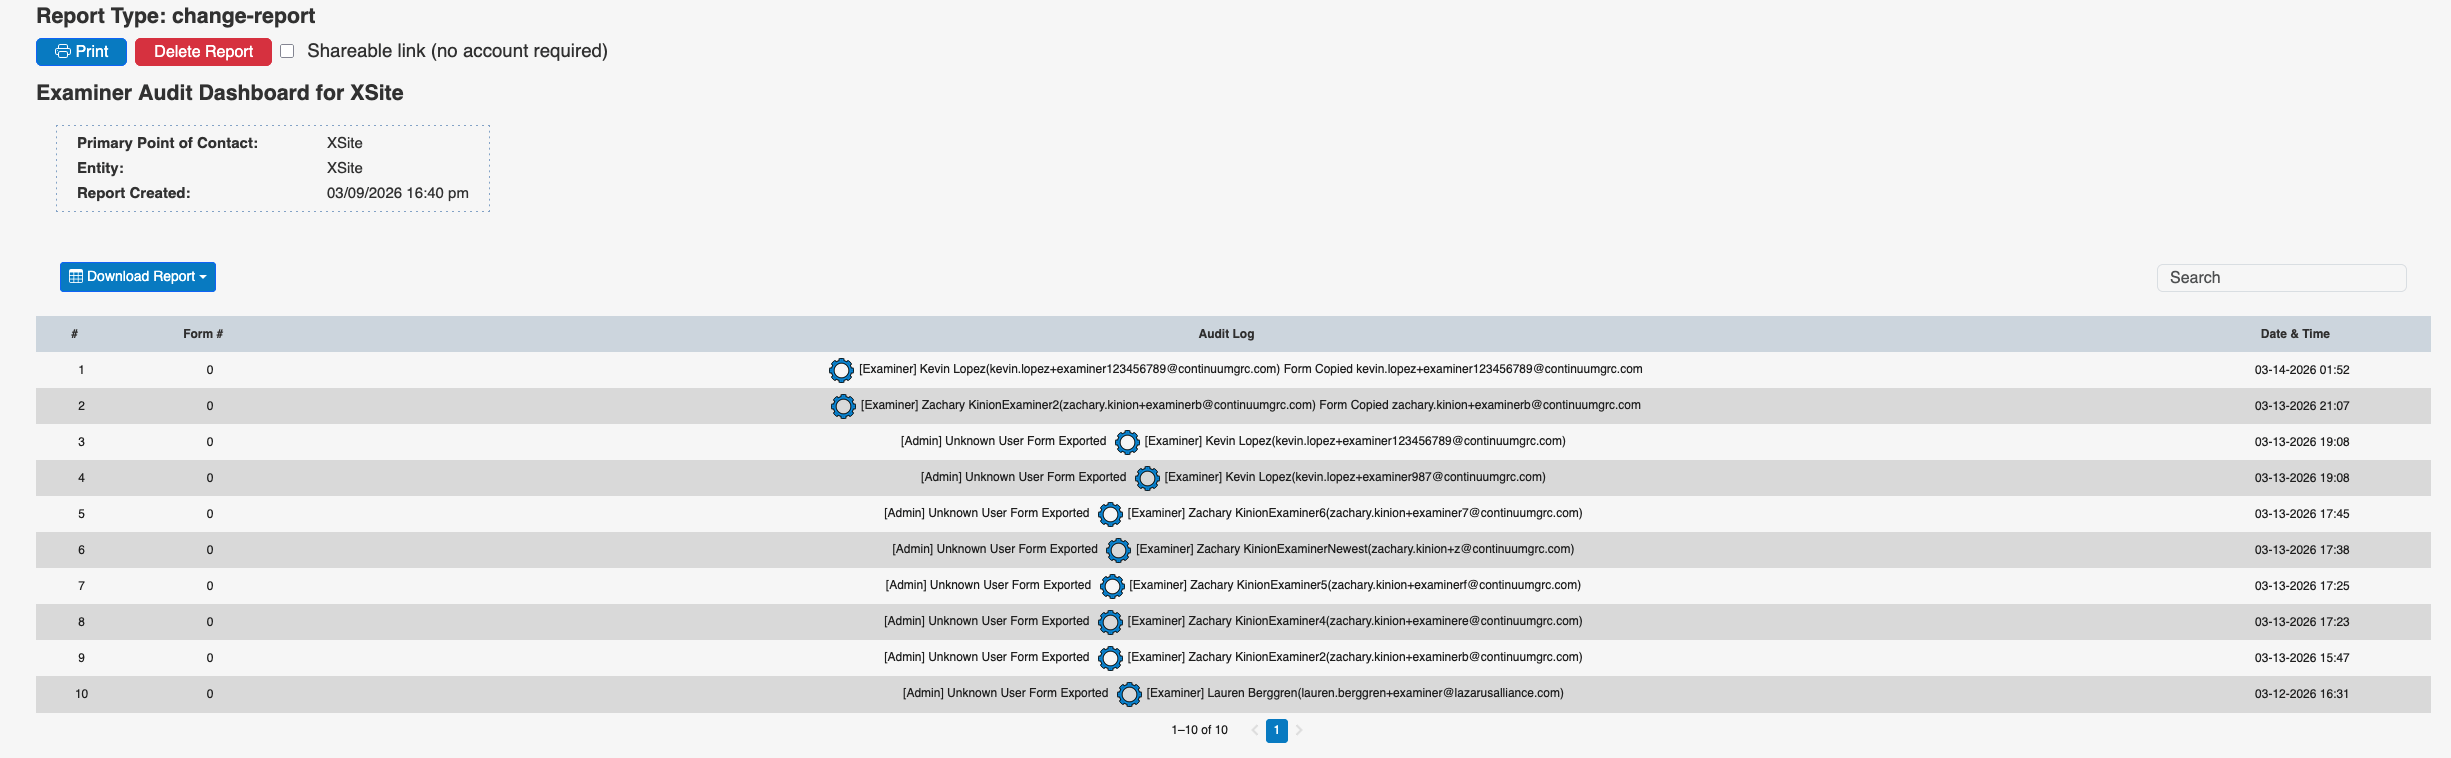
Use the Search field to quickly focus the report on a particular user, Form number, or date.
Artifact Management
The Artifact Management Report lists the artifacts associated with the forms that the user can access. An artifact is an external file uploaded and associated with the form, like an image or document. It shows the artifact's file name, the form it is associated with, and the field on that form, and includes a link to the field to view it directly. This report allows you to view all artifacts on a form in a single place, so you can quickly see if any are missing or find a particular artifact related to a specific form.
This report includes interactive features that differ from those in several other reports. All of the artifact file names are represented as links. Clicking the file link displays a preview and lets you download it. The report also includes a Go To Field column for each row. Clicking on the link in that column will take you directly to the field in the form where the artifact was uploaded.
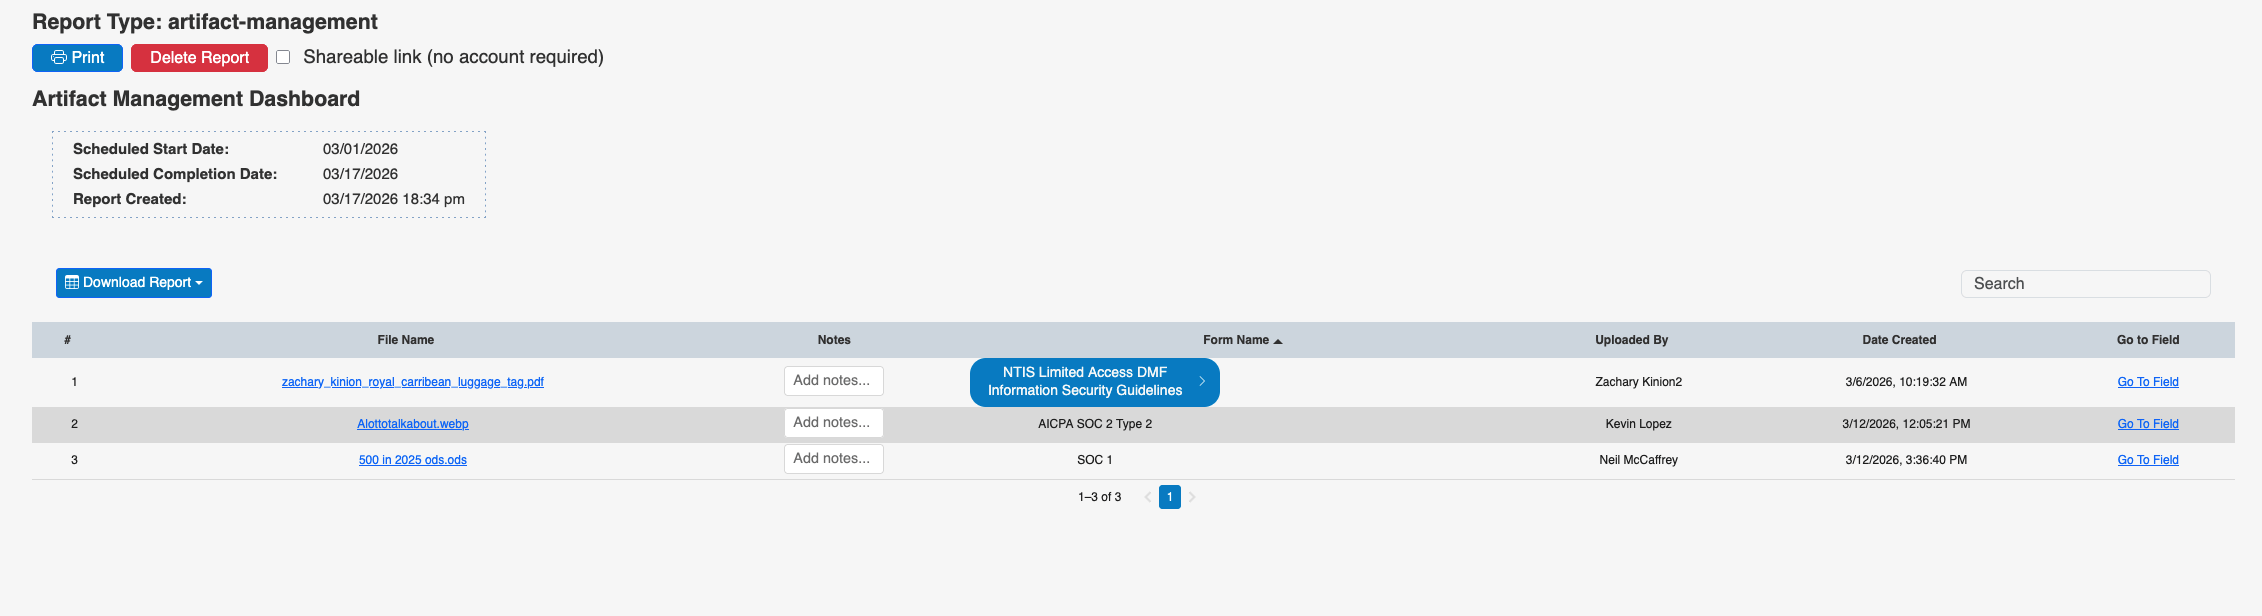
Searching/Filtering on part of a Form Name or on a Form ID is a great way to limit the results down to those related to a particular form
Compliance Dashboard
The Compliance Dashboard report displays an entity’s calculated compliance percentages against the selected forms as a current snapshot and over time. Compliance is based on the status of the fields in the selected forms. Each field in a form can be set to be in one of four statuses: Pending (Gray), In Remediation (Red), In Progress (Yellow), and Compliant (Green). For more information about status indicators and their use, see the Form Status Indicators section of the guide.
The report consists of a header and three main views of the compliance history and status of the chosen entity against the chosen forms. Below the header, the report will display two summary graphs and a detail section for each form.
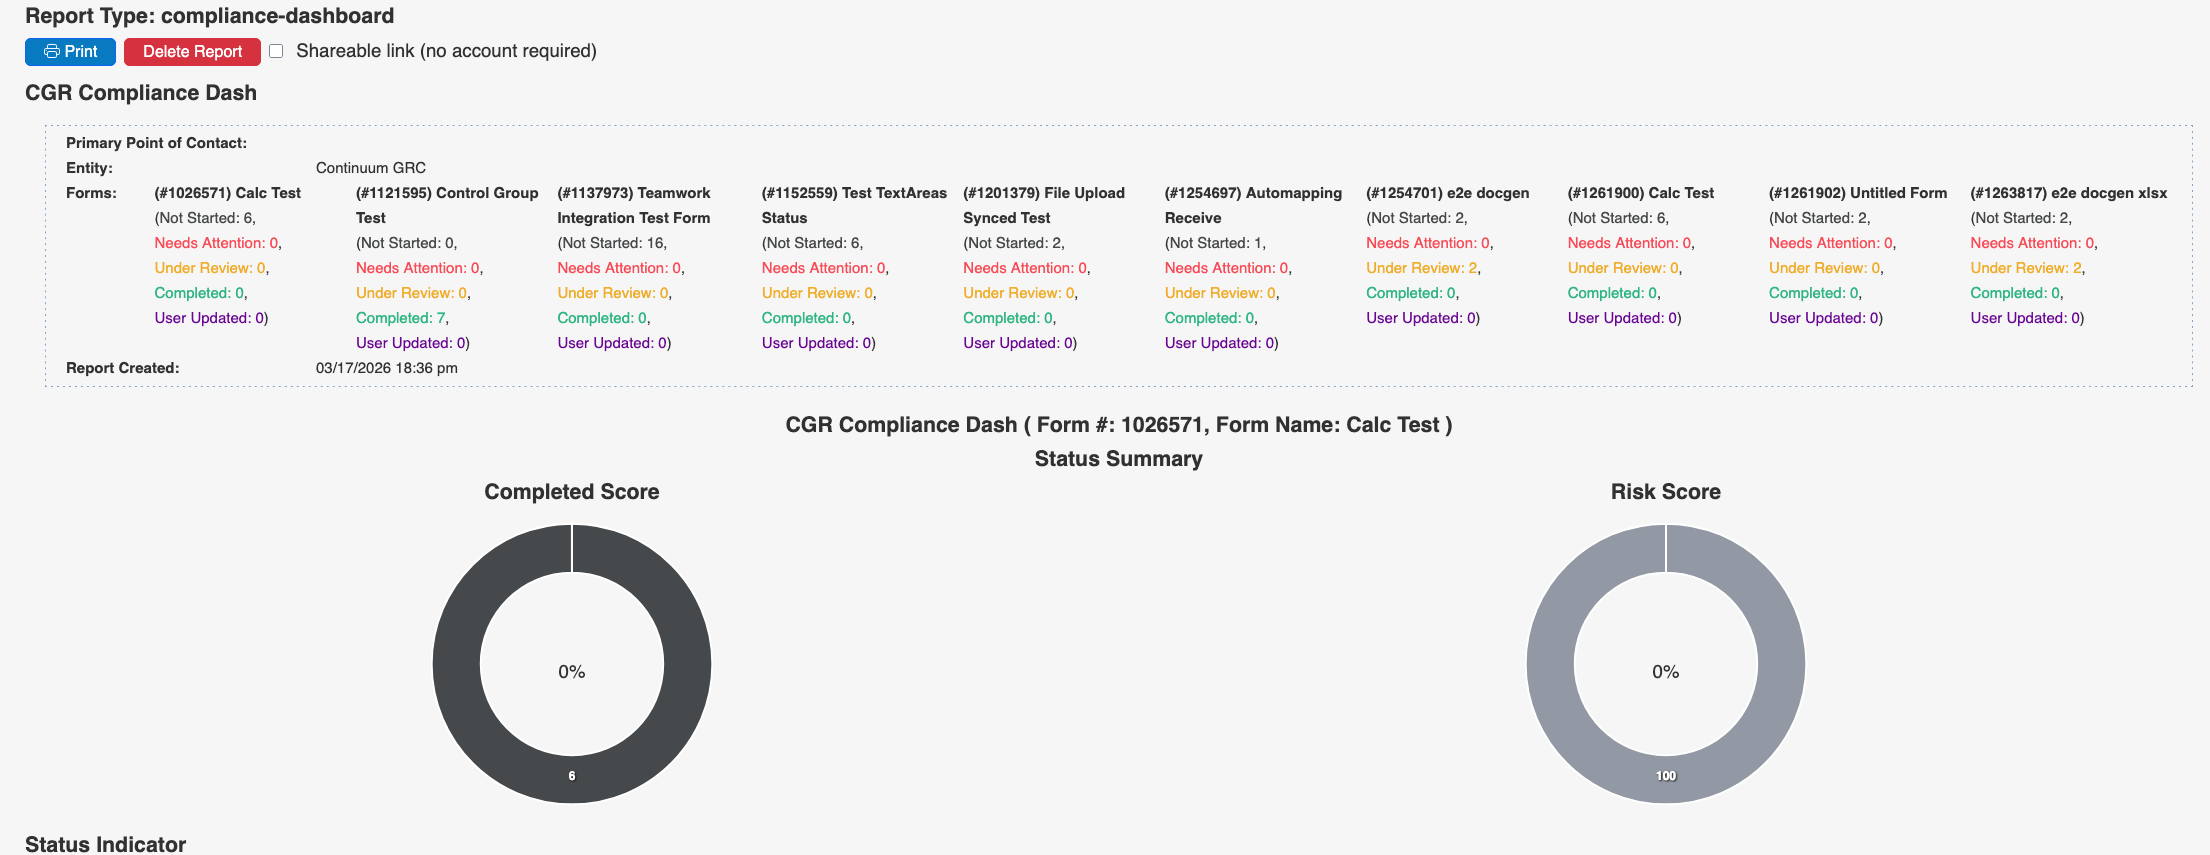
The top summary graph shows the entity's overall compliance status over time, providing a high-level view of its progress. The top line represents the Maturity score, and the bottom is the Risk Score. Each line can be hidden or displayed by clicking on the field in the legend under the chart.
The second summary graph shows the current compliance status. The Status Score displays the number of fields in each status and is the ratio of compliant fields to the total number of fields. Risk is calculated based on the scores of compliant controls (green) vs. less compliant controls. Maturity is a calculation based on the risk percentage and the number of compliant fields.
- A higher Status Score indicates better progress toward completion and compliance.
- A lower Risk Score is preferable, indicating a lower level of risk in the monitored system.
- A higher Maturity Score is desired, as it indicates that an entity has mitigated risk effectively and made greater progress toward compliance.
Finally, at the bottom is an accordion-style detail that allows viewing the fields for each status, displayed in the color associated with that status.
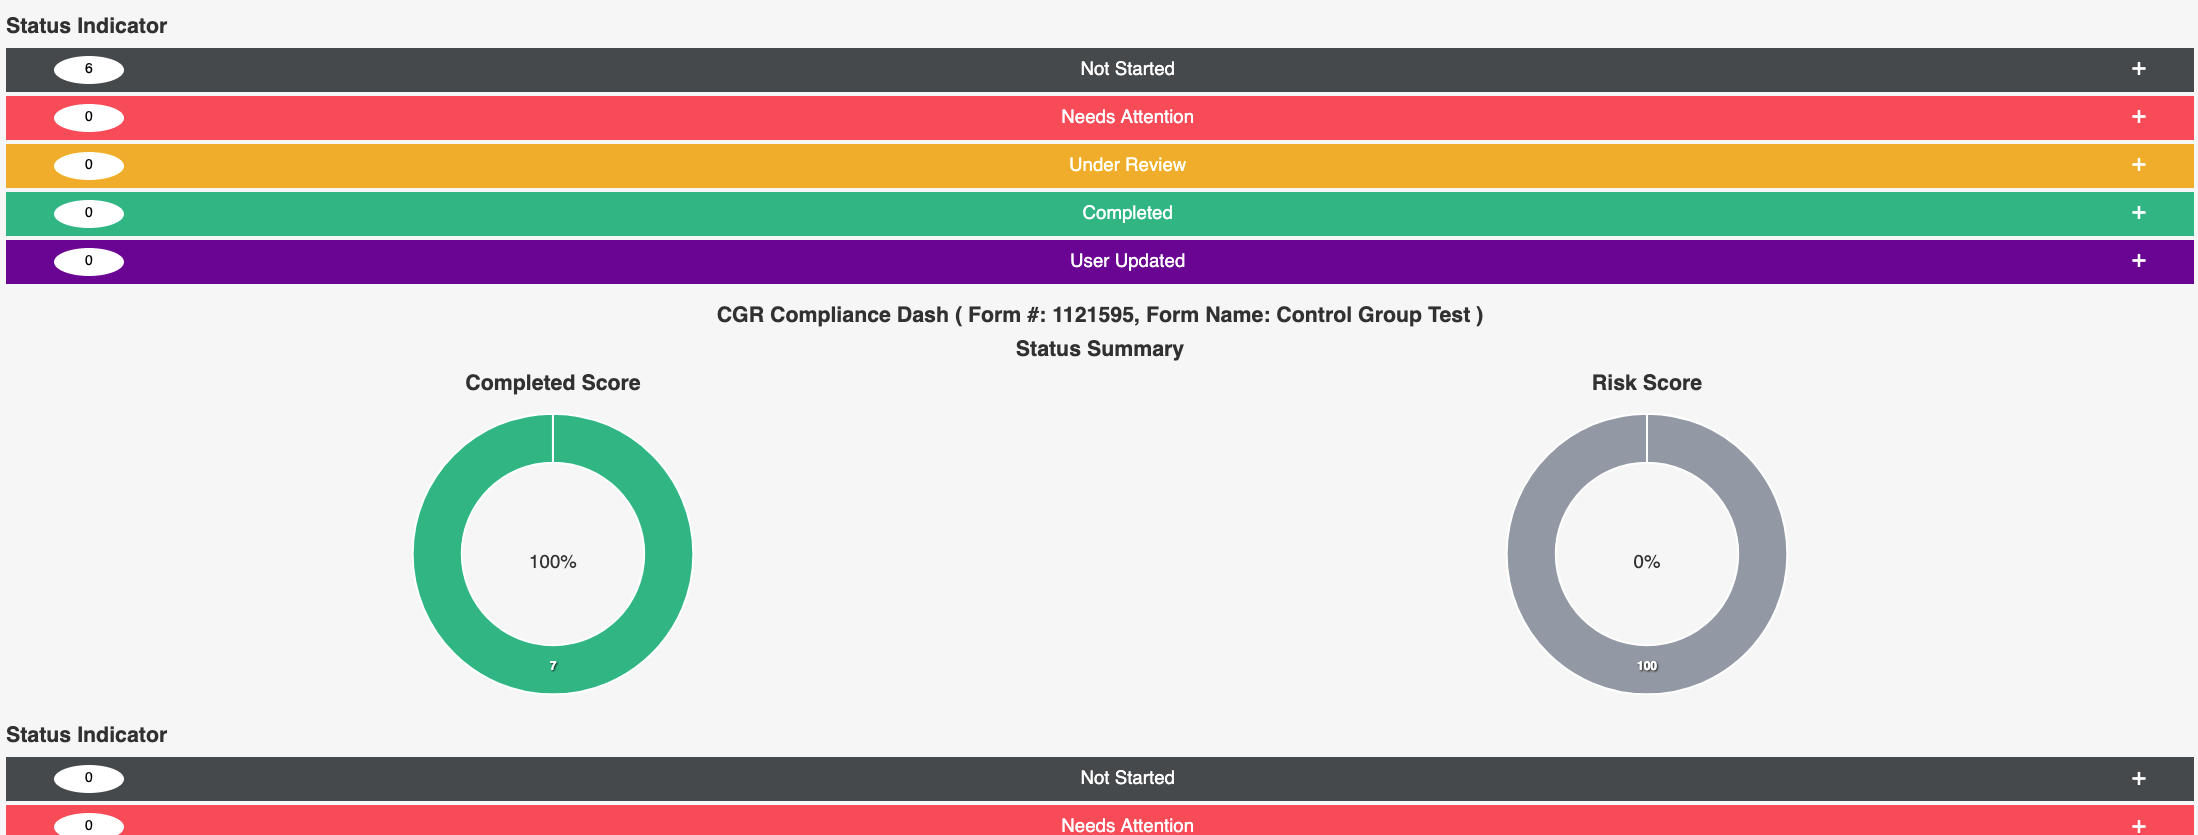
Expanding a status lets you view the fields in that status.
See the Form Status Indicators page for more details about each status
Executive Overview
The Executive Overview Report is a high-level version of the Compliance Dashboard, providing the big picture of compliance for the selected forms without field-level detail. The report includes a section for each selected form, providing a timeline and a summary of the compliance status. See the Compliance Report section for more details on each chart.
Note: The Executive Overview report does not provide details about which field is in which status, but provides the same data as the Compliance report.
Action ITAMs
The Action ITAM Report details the Action ITAMs created for a form. This report serves two purposes. One is to provide a quick way to review and download copies of the Action ITAMs for one or more forms. Reviewing an overview of the Action ITAMs or sharing them with a colleague can be helpful. The second is interactive and allows you to jump directly to fields with Action ITAMs and either update the field or the Action ITAM on the field.
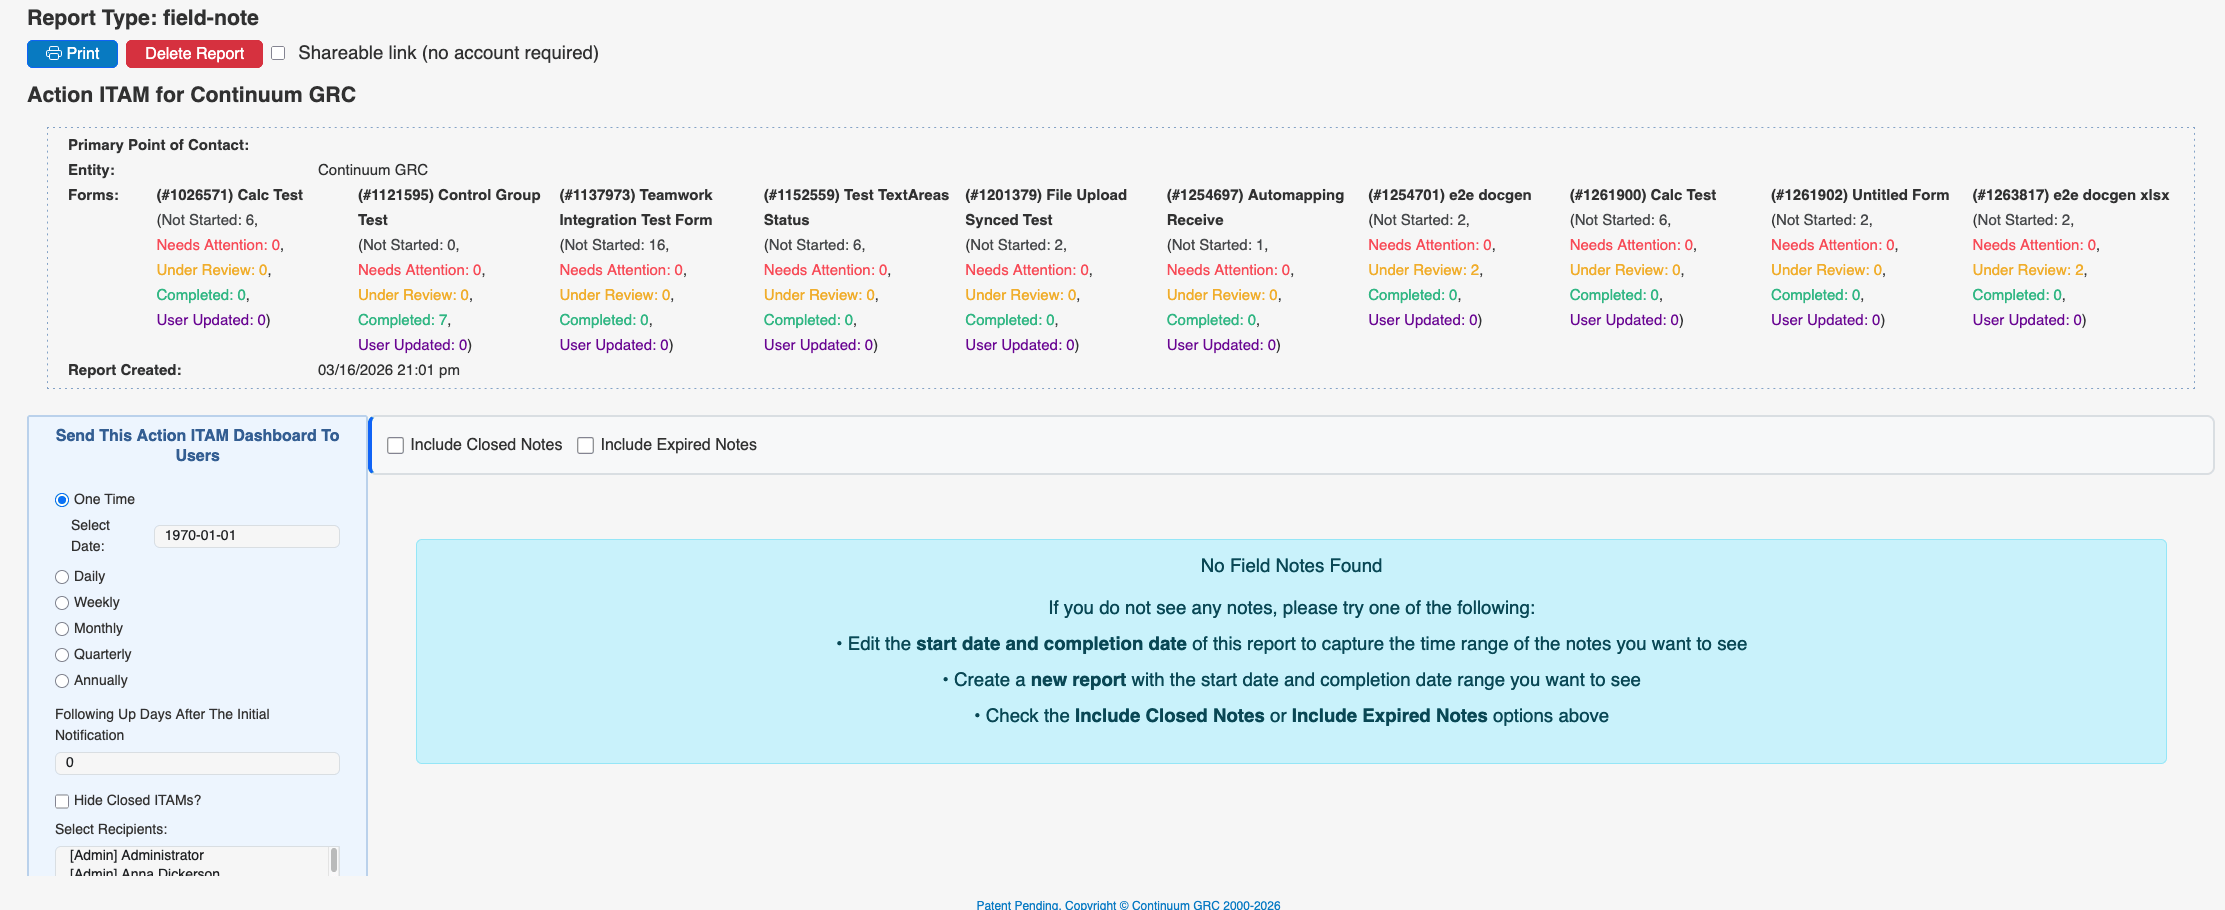
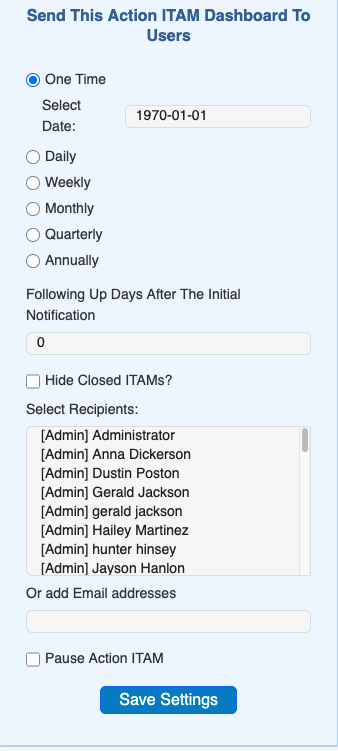
In addition, the form can be configured using the Send This Action ITAM Report To Users option to send it to one or more users, either one time or on a recurring schedule. This can be a helpful way to interact with portal users to maintain forward progress on their compliance efforts and provide a quick summary of the remaining actions. You can choose the frequency at which the report is sent, depending on your needs.
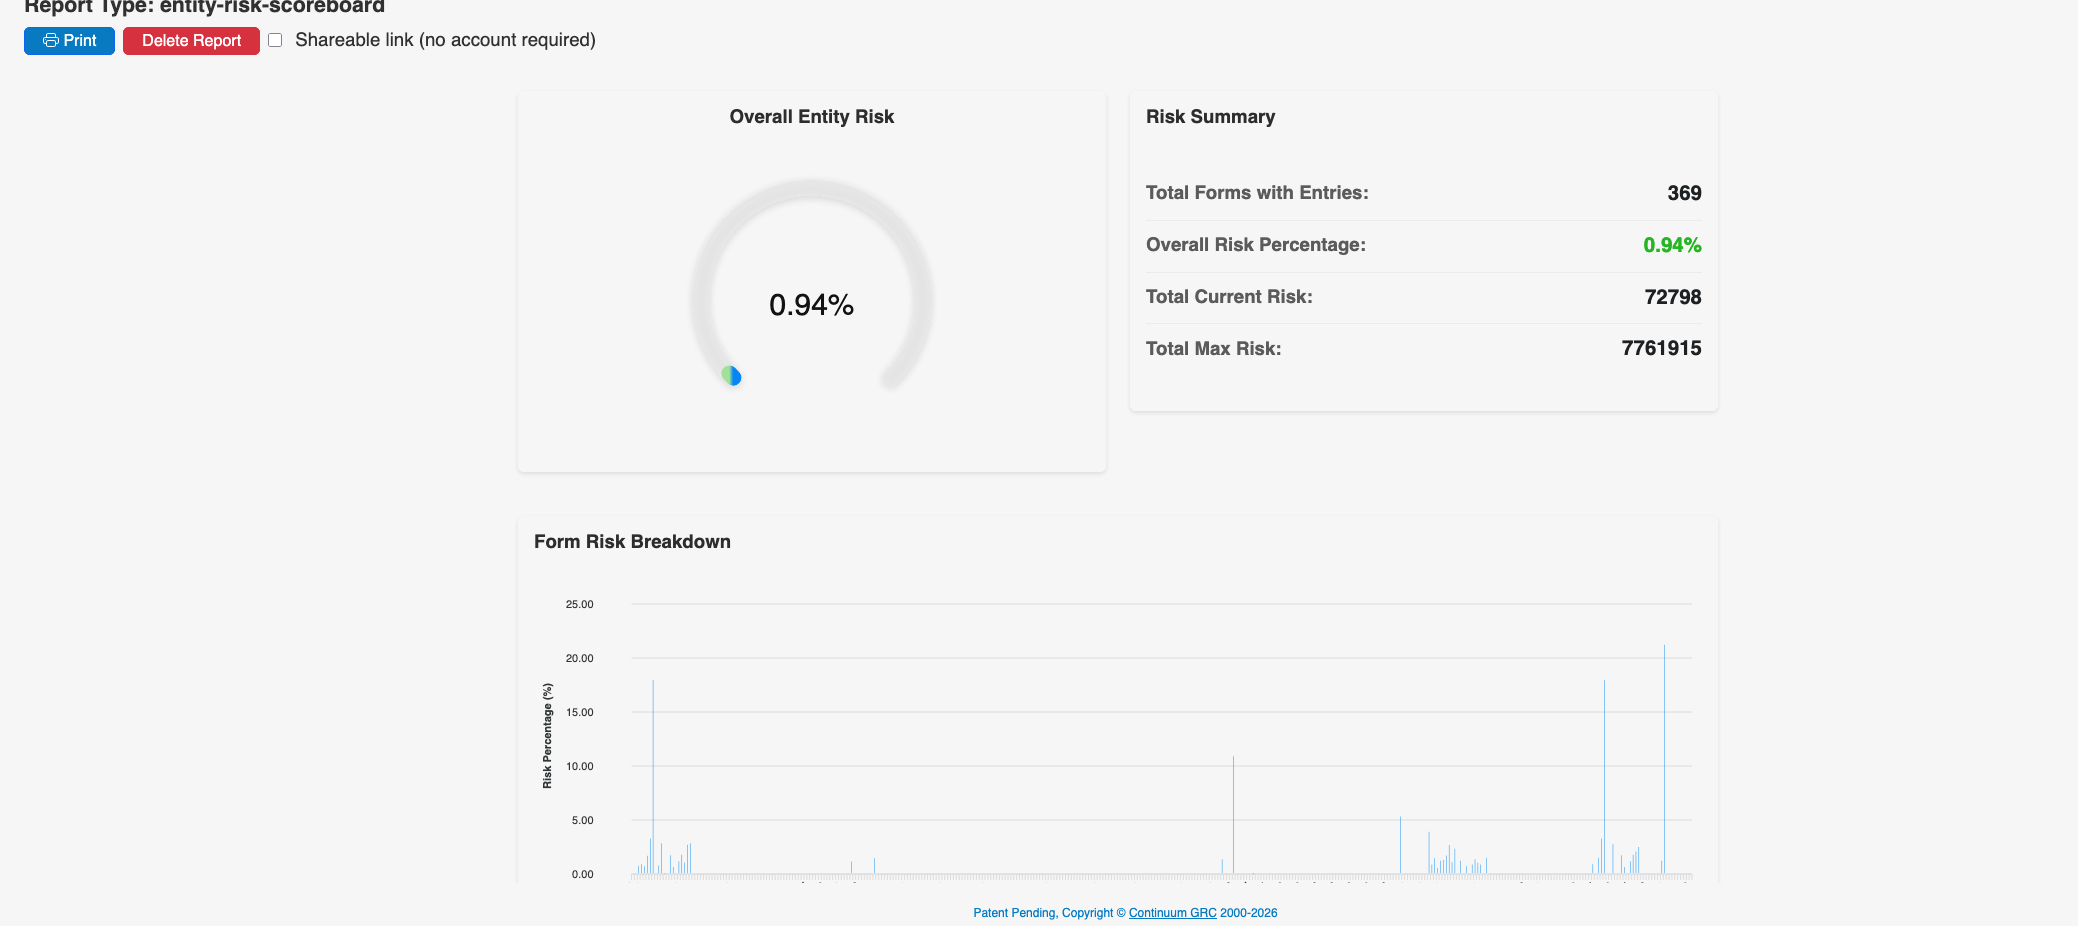
Risk Scores
The Risk Scores Report provides a more detailed view of the risk scores for one or more forms. In addition to the typical header, the report includes a section for each form that displays a line graph of the chosen type plotting the risk scores, along with a chart of the related data.
Status Indicators
The Status Indicators Report displays and charts the various states of the selected forms' status indicators. The top graph and chart compare the number of fields by status type, using the graph selected for the report:
- Line Chart
- Area Chart
- Column and Bar Chart
- Pie Chart
- Bubble Chart
- Sunburt Chart
- Heatmap
- Polar Chart
The accordion control at the bottom of the report lets you view the specific fields for each status as desired.
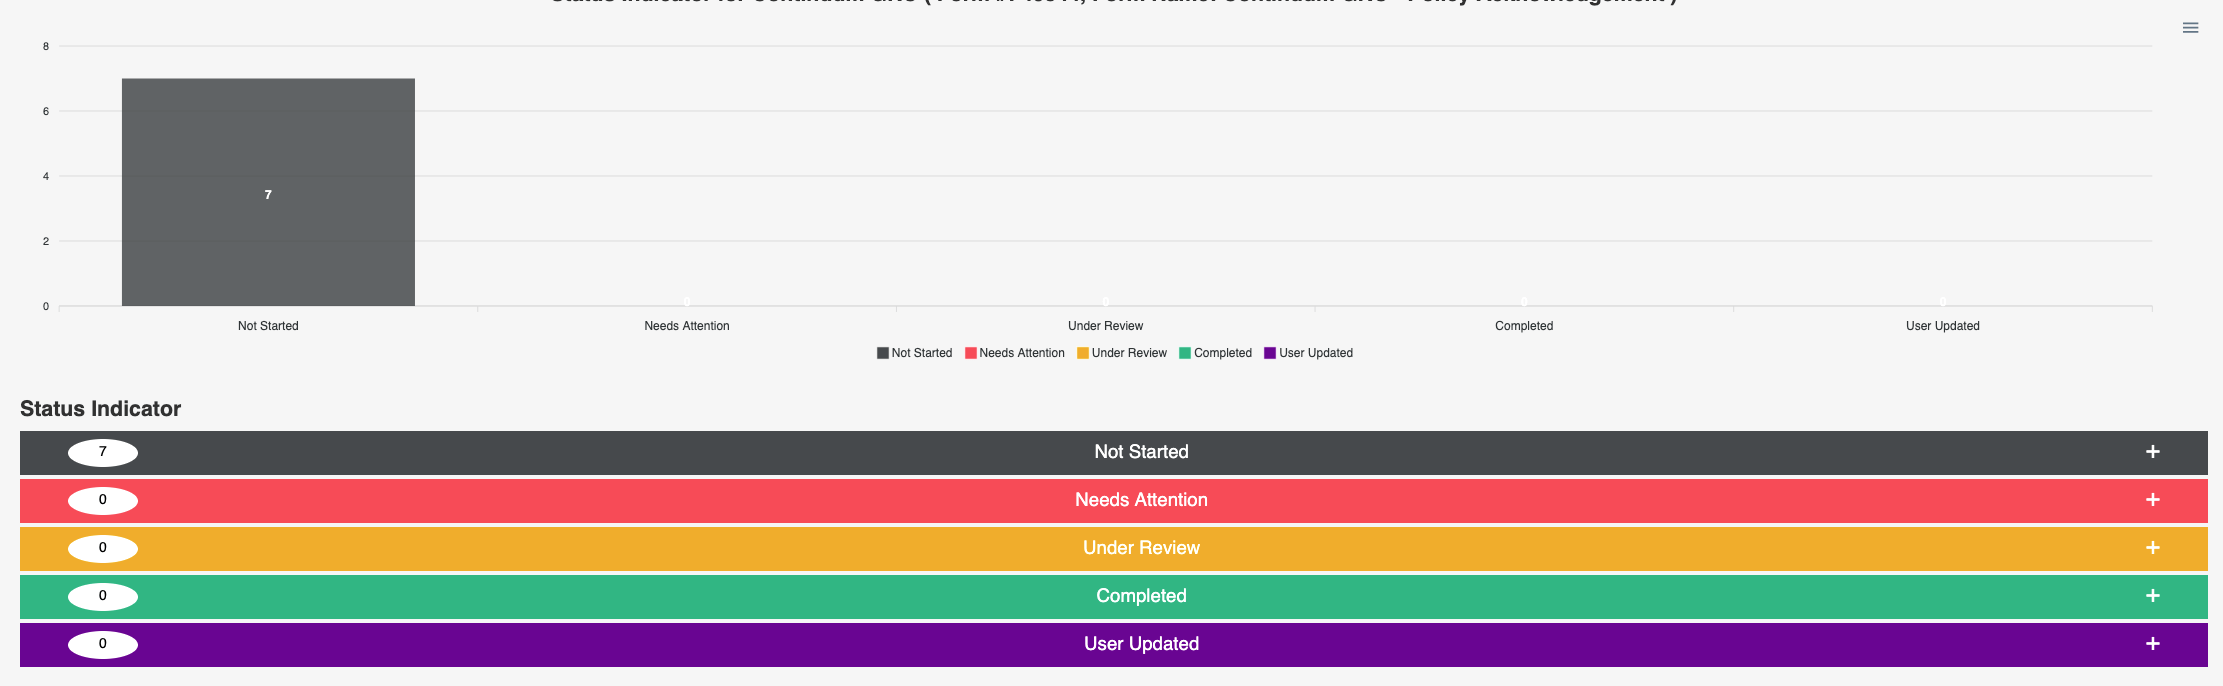
This report provides a good overview of the comparative status of the fields and lets you dig into the details.
Your Roadmap to Risk Reduction is just 2 clicks away with Continuum GRC!
Call 1-888-896-6207 to get your roadmap to risk reduction underway.