My Dashboard Overview
Users: My Dashboard View Overview
My Dashboard combines key information and pending tasks into one intelligent, actionable interface that users can leverage to navigate ITAM.
In this section, we will explore the areas of the My Dashboard interface, how each works, and how they make completing your tasks within the system easier.
My Dashboard View
The My Dashboard page is divided into three main areas:
- Your Action ITAMs
- Your Form Scores, and
- Status and Risk Indicators
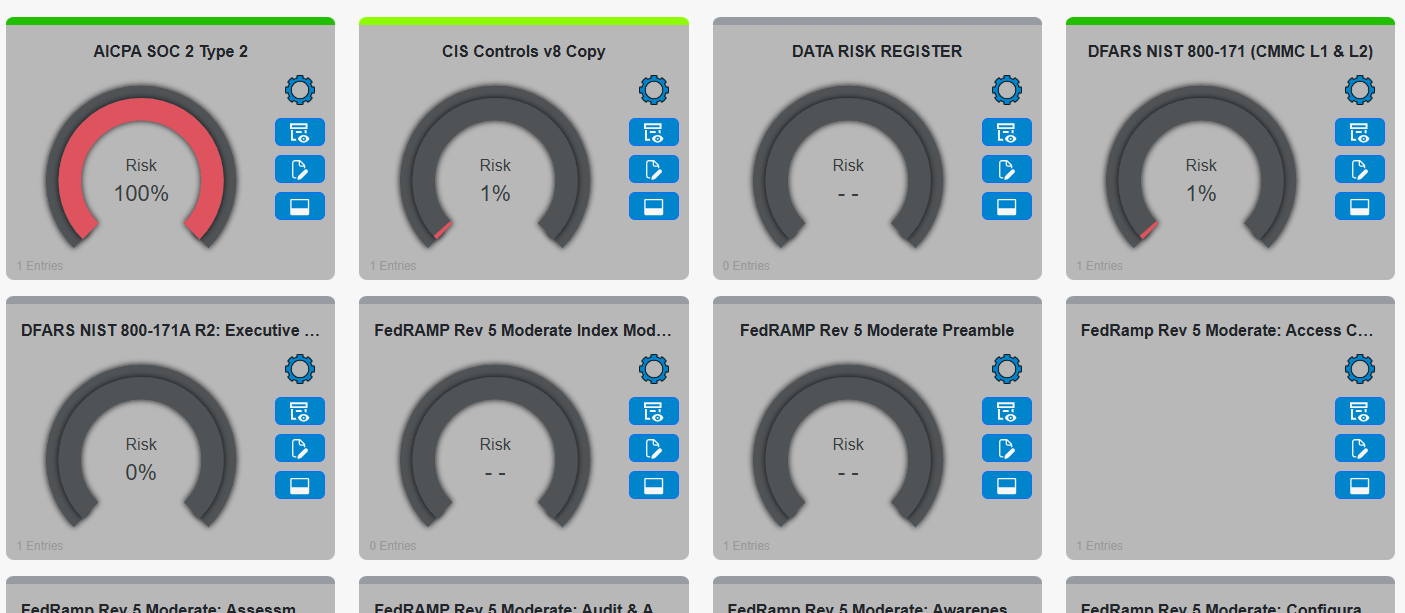
With the new ITAM layout, you'll find that form scores and risk indicators are part of a single visual:
Action ITAMS
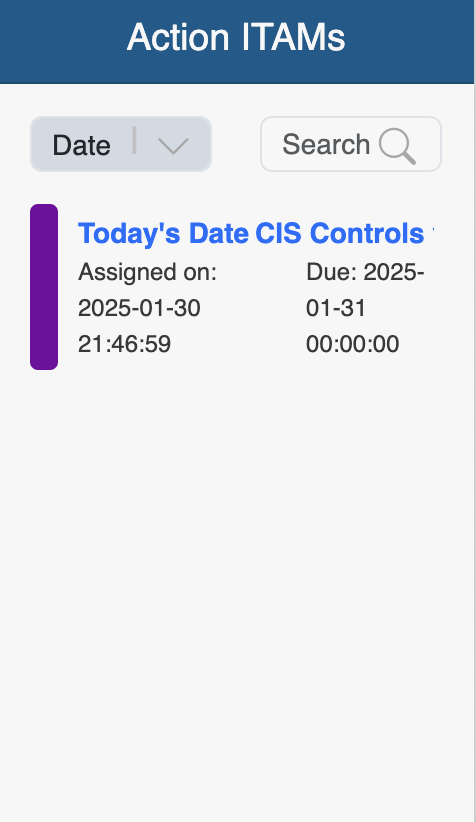
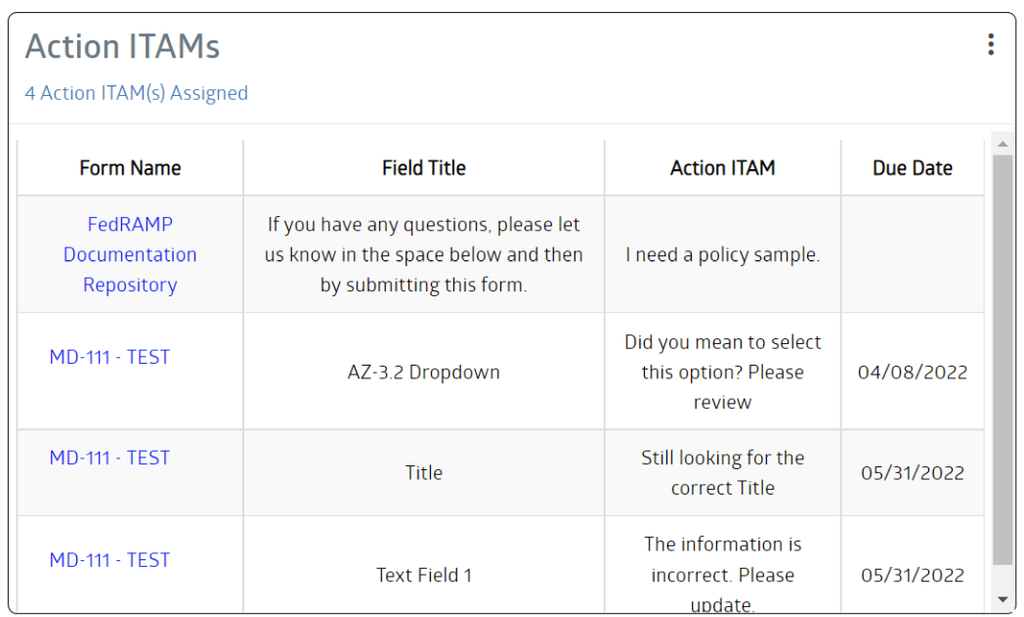
Action ITAMs represent a hybrid communication tool and tasker, allowing users to collaborate to help achieve compliance. The top right section of the My Dashboard interface displays the Action ITAMs currently assigned to you and will enable you to view more information about each.
Each line item in the list of Action ITAMs displays the Form Name, Title, Action ITAM, and Due Date of the associated Action ITAM. Clicking on the Form Name will bring you to the field in the form, allowing you to access the Action ITAMs on that field. The line items can also be sorted using the three (3) ellipses menu in the display's top left by selecting the desired sort.
For more information on Action ITAMs and how they are used, see this guide's Action ITAM section.
Scores
The My Dashboard interface's scores section displays the scores of the selected form. When first viewing the interface, the Score section will be empty, pending the selection of one of the forms from the lower section of the Dashboard. As soon as you click on a form in the lower section of the dashboard, the associated scores will be displayed.
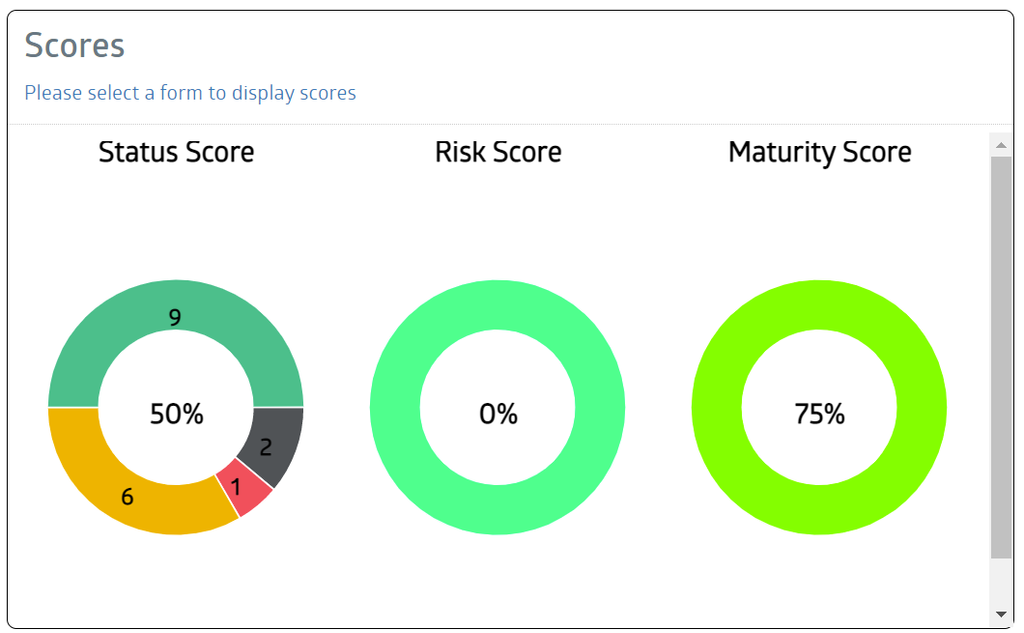
The Status Score displays the number of fields in each status, and the score is the ratio of compliant fields to the total number of fields. Risk is calculated based on the score of compliant controls (green) vs less compliant scores. Maturity is a calculation involving risk percentage and the number of compliant fields.
- A higher Status Score is better, showing better progress toward completion and compliance.
- A lower Risk Score is preferable, indicating a lower level of risk in the monitored system.
- A higher Maturity Score is desired, as it shows that an entity has mitigated risk well and has made better progress toward compliance.
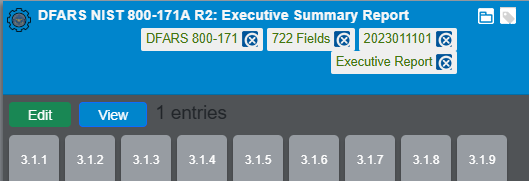
Above the expanded form name are the buttons for accessing the form for data entry and accessing the entries created for this form. See this guide's Form Data Entry or the Form Entries sections to learn more about entering data or working with form entries. Below the expanded form name are tiles representing any Control Groups in the form, color-coded by their current maturity level; for more information on how the control group tiles are used and control groups in general, see the Control Group section of this guide.
Ready to build your Roadmap to Risk Reduction?
Call 1-888-896-6207
Call 1-888-896-6207
Start Your Free 14-Day Trial
FedRAMP Authorized GRC Platform Featuring the World's First AI Auditor