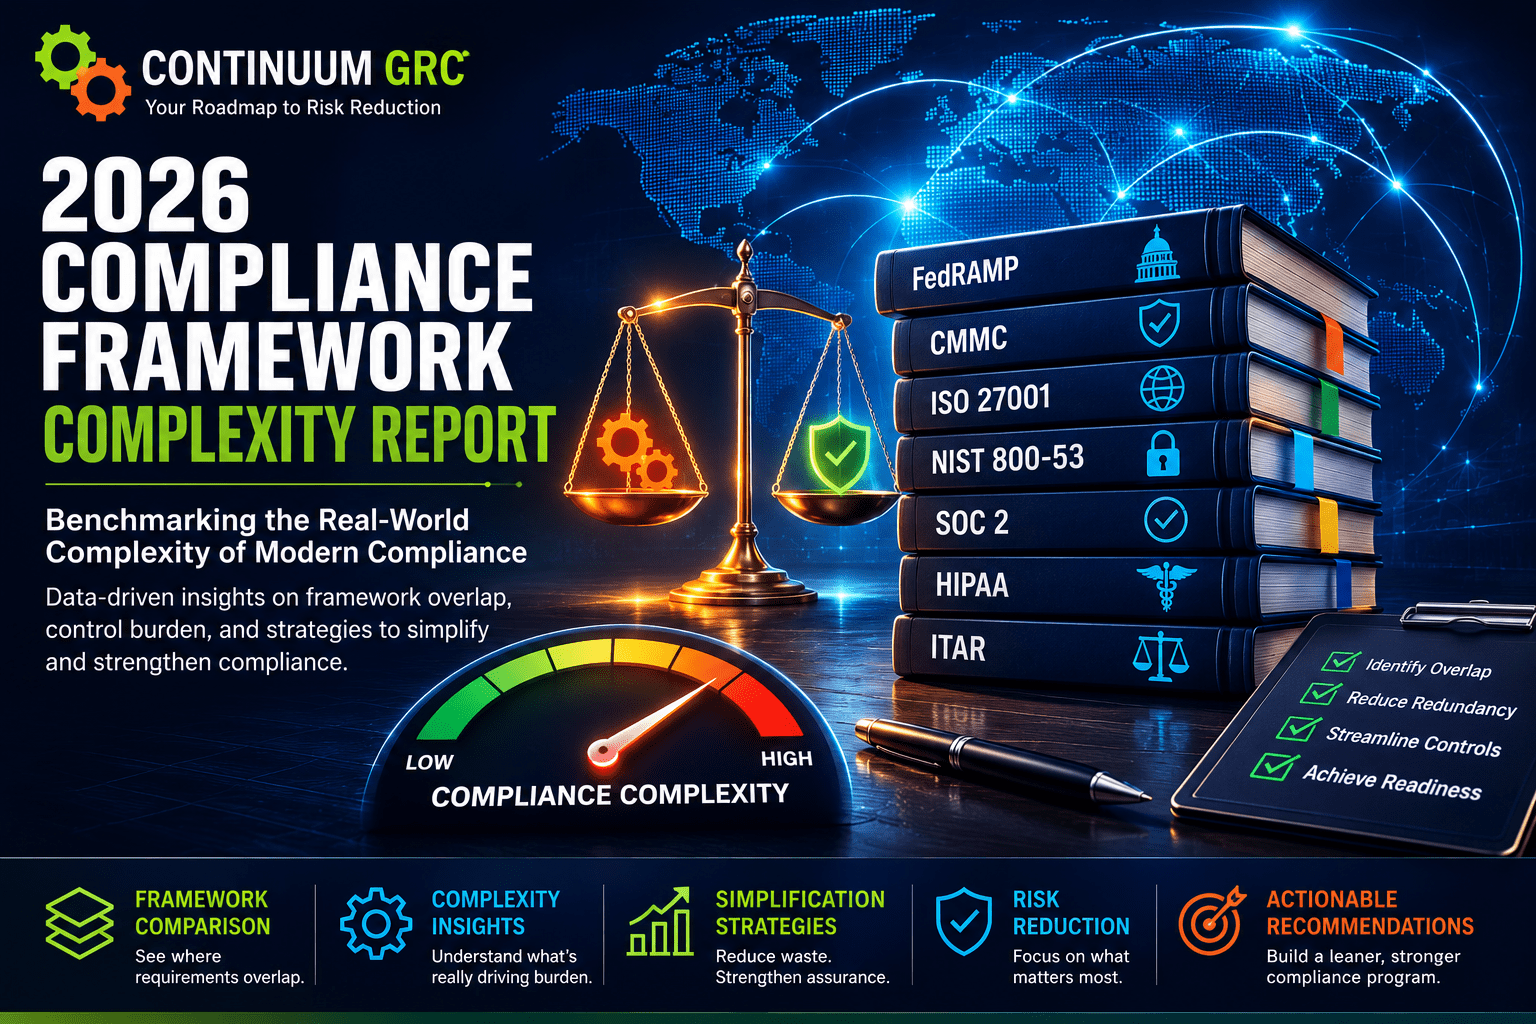
Independent customer-benchmark study
N = 275 programs
Control Load, Overlap & Multi-Framework Burden
Table of Contents
ToggleA structured view of how CMMC, FedRAMP, SOC 2, NIST, PCI DSS, ISO, and related regimes actually consume evidence, narratives, and labor — based on 275 Continuum GRC customer programs.
Executive Summary
Framework complexity is not just control count. It is the product of assessment objectives, evidence depth, inheritance documentation, technical testing, narrative load, and monitoring cadence. In this sample, programs that treated each framework as a separate project paid for the same proof more than once. Programs that maintained a unified library reused 41% of artifacts and cut the incremental cost of the next framework by 63%.
Study Methodology
This study analyzes 275 active Continuum GRC customer programs from January 2025 through June 2026. Complexity scoring combines six weighted factors: in-scope control count, assessment objectives or points of focus, unique evidence volume, technical-testing intensity, narrative and documentation load, and continuous-monitoring cadence.
Index scale: 0–100. Scores are relative to the frameworks observed in this customer base, not a regulatory ranking. Mix: CMMC 38%, FedRAMP/StateRAMP 22%, SOC 2 19%, NIST 800-53/FISMA 12%, other (PCI, ISO, CJIS, ITAR) 9%.
Sample mix by primary framework
Framework Complexity Index
FedRAMP sits at the top of the common baselines. CMMC Level 2 scores close behind because a single unmet objective can fail a practice. SOC 2 is the lightest major attestation in this set, but Type II period coverage still creates freshness pressure.
Composite complexity index (0–100)
| Framework | Index | Primary complexity driver |
|---|---|---|
| FedRAMP High | 94 | Control volume + testing + ConMon |
| FedRAMP Moderate | 88 | 323 controls, inheritance, 3PAO testing |
| NIST 800-53 / FISMA-style | 84 | Parameter-heavy overlays |
| CMMC Level 2 | 78 | ~320 objectives, hashing, CRM |
| PCI DSS v4 | 71 | Customized approach + defined-approach evidence |
| CJIS | 69 | Policy depth + personnel and access rules |
| ISO 27001:2022 | 61 | ISMS operation + Annex A mapping |
| SOC 2 Type II | 54 | Period evidence, not control count |
| CMMC Level 1 | 32 | Smaller practice set, self-assessment path |
Control & Evidence Load
Count and evidence move together, but not linearly. CMMC’s objective layer makes a 110-practice set behave like a much larger program. FedRAMP’s inheritance documentation adds artifacts that are not “controls” but still consume assessor time.
Typical in-scope load
| Framework | Controls / practices | Objectives / PoF | Avg artifacts |
|---|---|---|---|
| CMMC Level 2 | 110 | ~320 | 1,380 |
| FedRAMP Moderate | ~323 | High | 3,150 |
| NIST 800-53 / FISMA | ~261–323 | High | 2,410 |
| SOC 2 Type II | ~64–92 | Moderate | 980 |
| ISO 27001:2022 | 93 Annex A | Moderate | 1,120 |
| PCI DSS v4 | 12 / ~250+ | High | 1,540 |
Multi-Framework Stacking
Most Continuum GRC customers are not single-framework programs. The labor problem appears when the second and third frameworks are collected as if the first never happened.
Frameworks in scope per program
Stacking snapshot
| Scope | Share of N=275 |
|---|---|
| One framework | 39% |
| Two frameworks | 34% |
| Three frameworks | 18% |
| Four or more | 9% |
Labor, Time & Cost of Complexity
Hours below are annual sustainment plus one assessment-cycle authoring pass, using a $125 fully loaded blended rate (compliance analyst, control owner, and technical writer mix). Siloed means separate evidence folders, separate narratives, and little reuse. Unified means one mapped control library.
Added annual labor for each extra siloed framework
Incremental labor cost of that extra siloed framework
Incremental hours when the next framework is mapped into a unified library
Unified incremental cost — 63% below the siloed path
Annual sustainment hours
Annual sustainment labor cost
| Program shape | Annual hours | Labor at $125/hr | Versus 1-framework baseline |
|---|---|---|---|
| One framework, mixed collection | 420 | $52,500 | Baseline |
| Two frameworks, siloed | 760 | $95,000 | +81% |
| Three frameworks, siloed | 1,080 | $135,000 | +157% |
| Three frameworks, unified library | 580 | $72,500 | +38% |
| Three unified + A.ITAMBot authoring | 410 | $51,250 | −2% vs baseline |
What Actually Drives Complexity
Objective density
CMMC fails at the objective, not the practice headline. Programs that mapped evidence only to the 110 practices under-prepared for ~320 assessable statements.
Inheritance and CRM
Cloud and MSP boundaries add a documentation layer that is easy to underestimate. Weak customer-responsibility matrices were a recurring complexity tax in both CMMC and FedRAMP.
Period evidence
SOC 2 Type II and FedRAMP ConMon punish stale artifacts. A short control list is still complex if every operational control needs dated proof across the window.
Technical testing
Penetration tests, scans, FIPS validation, and boundary walkthroughs add artifacts that do not map one-to-one to a policy. FedRAMP carries the heaviest testing load in this sample.
Narrative load
SSP, SAP/SAR, implementation statements, and statements of applicability are where complexity becomes writing time. In this sample, A.ITAMBot compressed that authoring workstream by 92%.
Duplicate collection
Without a unified library, overlapping controls were evidenced 1.8 times on average. Access reviews, logging, vulnerability management, and training were the most duplicated families.
Benefits of Automation
Unified mapping absorbs the next framework
Siloed incremental cost of one additional framework: 310 hours / $38,750. Unified-library incremental cost: 95 hours / $14,200. A.ITAMBot™ then accelerates remaining technical writing — SSP narratives, implementation statements, procedures, and POA&M language — by 92% (208 hours → 17 hours on that workstream).
Cross-framework reuse
- 41% of artifacts reused across frameworks in unified programs
- Up to 40% less redundant collection versus separate repositories
- One access review, logging architecture, or training record serving CMMC, SOC 2, and NIST
A.ITAMBot writing
- 92% faster SSP, control narratives, procedures, and POA&M language
- $23,875 labor avoided per authoring cycle at $125/hr
- Consistent wording across stacked frameworks instead of conflicting drafts
Complexity made visible
- Live control-to-framework maps show true unique load
- Inheritance and CRM tracked as first-class records
- Dashboards replace spreadsheet crosswalks as the system of record
Recommendations
- Score complexity by objectives, evidence, testing, and narratives — not by control count alone.
- Build one control library before adding the second framework. The incremental cost gap is 310 hours versus 95 hours.
- Map CMMC evidence to assessment objectives, not only to the 110 practices.
- Treat CRM / inheritance as a living artifact. It is a complexity driver, not an appendix.
- Reuse operational evidence (reviews, logs, vuln remediation, training) across every applicable framework.
- Use A.ITAMBot for the narrative layer so stacked frameworks do not multiply writing time by the same factor as control count.
Continuum GRC and Framework Harmonization
Continuum GRC (IT Audit Machine®) and A.ITAMBot™ exist to collapse stacked complexity: unified mapping, inheritance, hashed evidence, readiness dashboards, and AI-assisted technical writing. In this sample, a three-framework program that stayed siloed cost about $135,000 a year in sustainment labor. The same shape, unified and A.ITAMBot-assisted, sat near $51,250 — roughly the cost of a single mixed framework with no reuse.
Framework complexity will not shrink. FedRAMP, CMMC, and overlay-heavy NIST programs are not getting smaller. The only controllable variable is whether each new requirement is collected from scratch or absorbed into a library that already proves the control.