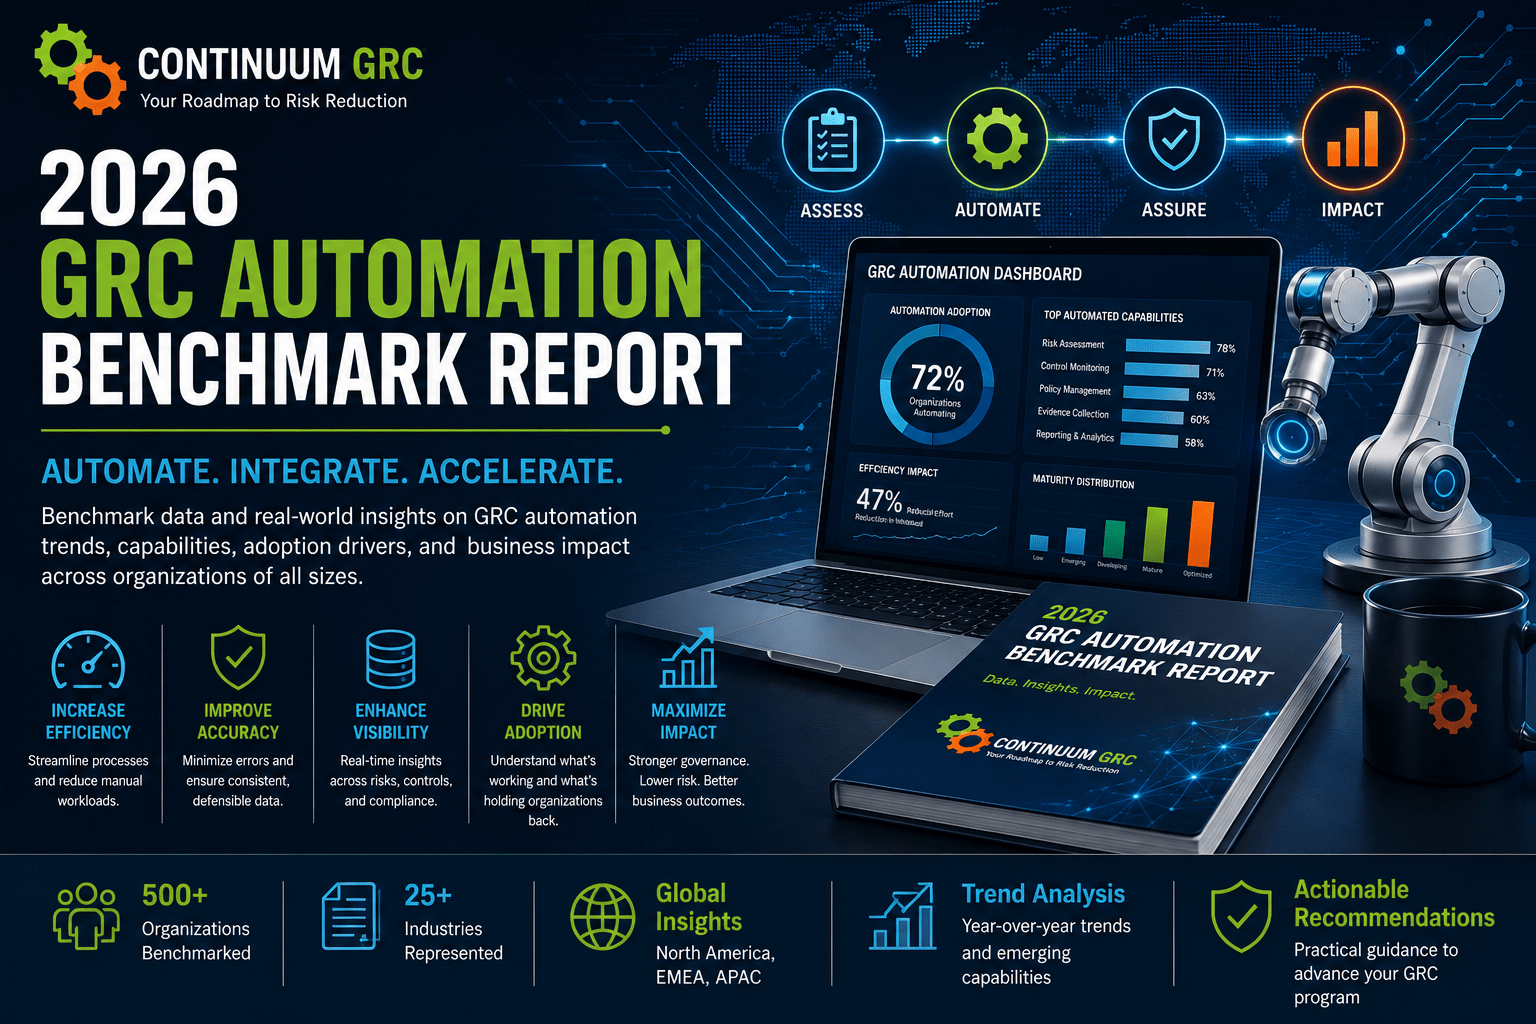
Independent customer-benchmark study
N = 275 programs
Evidence, Authoring & Operating Leverage
Table of Contents
ToggleHow 275 Continuum GRC programs actually automate collection, mapping, monitoring, and technical writing — and what that does to hours, labor cost, and audit calendar.
Executive Summary
Automation in this sample is not binary. Most programs automate some collection and still write narratives by hand. The programs that pulled away combined three layers: scheduled or integrated evidence, a unified control map, and A.ITAMBot for authoring. That combination is where the 74% assembly reduction and the 92% writing reduction show up in the same cycle.
Study Methodology
Independent analysis of 275 active Continuum GRC customer programs from January 2025 through June 2026. Automation rate is the share of mapped artifacts created by integration, scheduled export, or workflow — not by ad hoc upload. Authoring time is taken from SSP, control-implementation, procedure, mapping-note, and POA&M writing cycles.
Maturity bands: manual (under 30% automated evidence), mixed (30–70%), high (over 70%). Mix: CMMC 38%, FedRAMP/StateRAMP 22%, SOC 2 19%, NIST 800-53/FISMA 12%, other 9%.
Sample mix by primary framework
Automation Maturity
Nearly half the sample sits in the mixed middle: some integrations, still a large manual residue. The performance gap is between that middle and the high-automation third — not between mixed and fully manual.
Programs by automation band
| Band | Share | Programs | Median auto rate |
|---|---|---|---|
| Manual (<30%) | 22% | 61 | 18% |
| Mixed (30–70%) | 47% | 129 | 51% |
| High (>70%) | 31% | 85 | 81% |
| All programs | 100% | 275 | 54% |
What Gets Automated
Collection is ahead of authoring. Identity, endpoint, and cloud configuration evidence automate first. Log review, access recertification commentary, and SSP prose remain the last manual islands — unless A.ITAMBot is in use.
Share of work automated by workstream
| Workstream | Avg automated | Coverage |
|---|---|---|
| Cloud / IdP configuration evidence | 76% | |
| Vulnerability and patch artifacts | 71% | |
| Training and HR acknowledgments | 64% | |
| Ticket and change records | 58% | |
| Control-to-evidence mapping | 49% | |
| Access-review operating evidence | 44% | |
| Log-review and alert handling proof | 37% | |
| SSP and control narratives (no A.ITAMBot) | 11% | |
| SSP and control narratives (with A.ITAMBot) | 88% |
Time, Labor & Cost
High automation changes the assessment calendar. Manual programs still spend more than two months assembling a package. High-automation programs spend just over two weeks — and most of that is review, not hunting.
Assembly hours avoided per cycle at high automation (220 → 48)
Labor saved on package assembly at $125/hr
Authoring hours avoided with A.ITAMBot (208 → 17)
Labor saved on technical writing per cycle
Evidence-package assembly time
Annual internal labor cost by maturity
| Maturity | Assembly hours | Annual sustainment hours | Annual labor | Versus manual |
|---|---|---|---|---|
| Manual | 220 | 640 | $80,000 | Baseline |
| Mixed | 110 | 470 | $58,750 | −27% |
| High automation | 48 | 310 | $38,750 | −52% |
| High + A.ITAMBot | 36 | 260 | $32,500 | −59% |
Median annual labor avoided when a manual program reaches high automation plus A.ITAMBot: $47,500 ($80,000 → $32,500).
A.ITAMBot™ Technical Writing & Readiness
A.ITAMBot accelerates technical writing and audit readiness
Used in 39% of programs in this sample (107 of 275). Manual authoring baseline: 208 hours. A.ITAMBot-assisted baseline: 17 hours. That is the largest single-task gain measured in the study — larger than collection automation alone.
Authoring hours by task
Authoring labor cost at $125/hr
| Authoring workstream | Manual hours | A.ITAMBot hours | Time saved | Labor saved |
|---|---|---|---|---|
| SSP / control implementation narratives | 96 | 8 | 88 hrs | $11,000 |
| Policy and procedure drafts | 40 | 3 | 37 hrs | $4,625 |
| Evidence mapping statements | 48 | 4 | 44 hrs | $5,500 |
| Gap write-ups and POA&M language | 24 | 2 | 22 hrs | $2,750 |
| Total | 208 | 17 | 191 hrs (92%) | $23,875 |
What A.ITAMBot writes
- First-draft SSP and control narratives from mapped evidence
- Procedure language aligned to the live control record
- Consistent wording across stacked frameworks
What still needs a human
- Scope and inheritance decisions
- Acceptance of residual risk and POA&M dates
- Assessor walkthroughs and live demonstrations
Calendar effect
- Authoring compressed from about five weeks to about two days
- Reviewers edit a draft instead of building one
- Stacks with the 74% reduction in package assembly
What Still Blocks Automation
The 22% still in the manual band were not missing a platform. They were missing owners, a defined evidence standard per control, and a rule that recurring operational proof must be generated by a workflow. Automation failed most often on AU-family review evidence and account recertification — the same families that produce late assessor requests.
Recommendations
- Measure automation rate as the share of mapped artifacts created by integration or schedule, not as “we have a GRC tool.”
- Move identity, cloud, vulnerability, and training evidence first. Those four families already exceed 60% automation in this sample.
- Do not stop at collection. The 92% writing gain only appears when A.ITAMBot sits on top of mapped, current evidence.
- Give every operational control a dated artifact standard and an owner. Unowned review evidence stays manual.
- Target the high-automation band: more than 70% automated evidence and authoring inside the same platform.
- Report two KPIs monthly: percent of artifacts automated, and hours spent on last-cycle authoring.
Continuum GRC as the Automation Layer
Continuum GRC (IT Audit Machine®) and A.ITAMBot™ are built to automate the three layers that actually move the numbers in this study: evidence collection and hashing, control-to-artifact mapping, and technical writing. Programs that used all three sat at 36 assembly hours and 260 annual sustainment hours — 59% below the manual band.
GRC automation is not a dashboard. It is a reduction in hours between “the control operated” and “the assessor can see that it operated.” That is the benchmark.