Admin DevOps
A major part of an administrator’s job is monitoring and managing the health of their ITAM instance. The Continuum GRC team can and will help with this, but admins and developers must work from a shared source of truth to keep the system running smoothly.
This is where the DevOps dashboard comes into play. This page is a collection of monitors and controls that you can use to gather telemetry on what’s happening under the hood. We’ll cover each of these in more detail in later lessons, but for now, here’s a brief overview of the section.
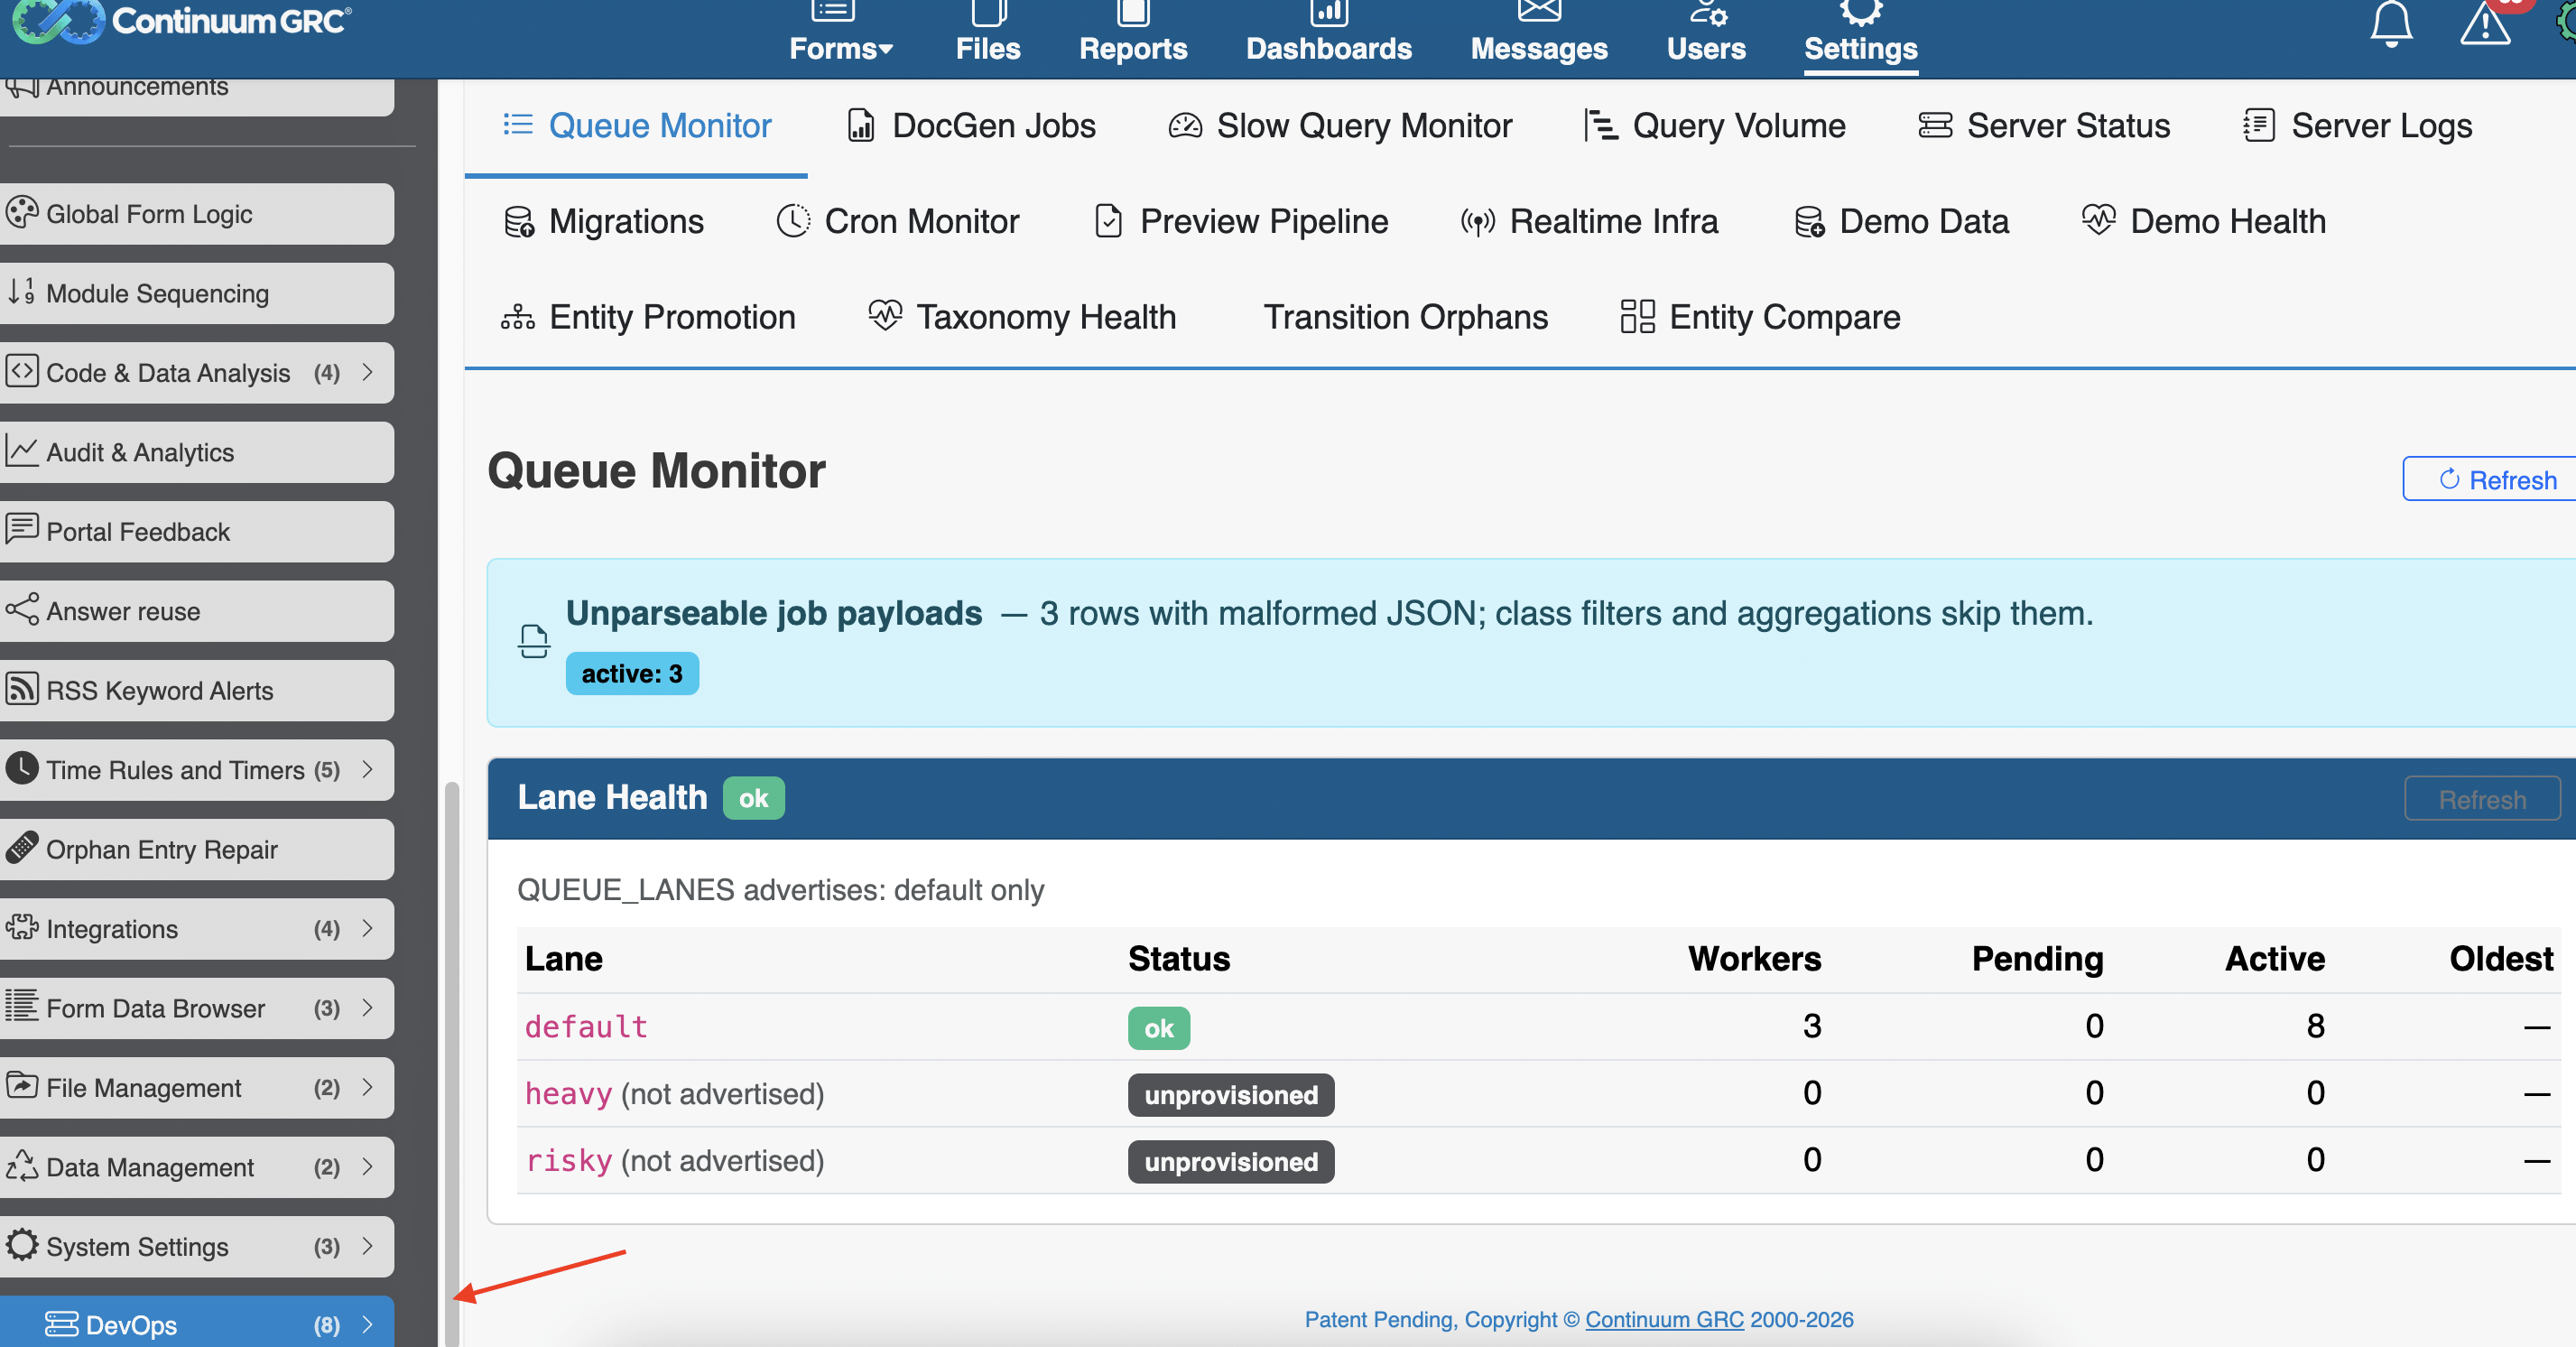
Queue Monitor
First, the Queue Monitor. The ITAM platform is a complex piece of software, and throughout the day, several automated threads and processes work together to complete tasks. The Queue Monitor gives admins a bird’s-eye view of these processes and, when needed, the tools to fix issues. At the top of the dashboard, you’ll see alerts about workers that need your attention, along with quick-fix actions to remedy those issues.
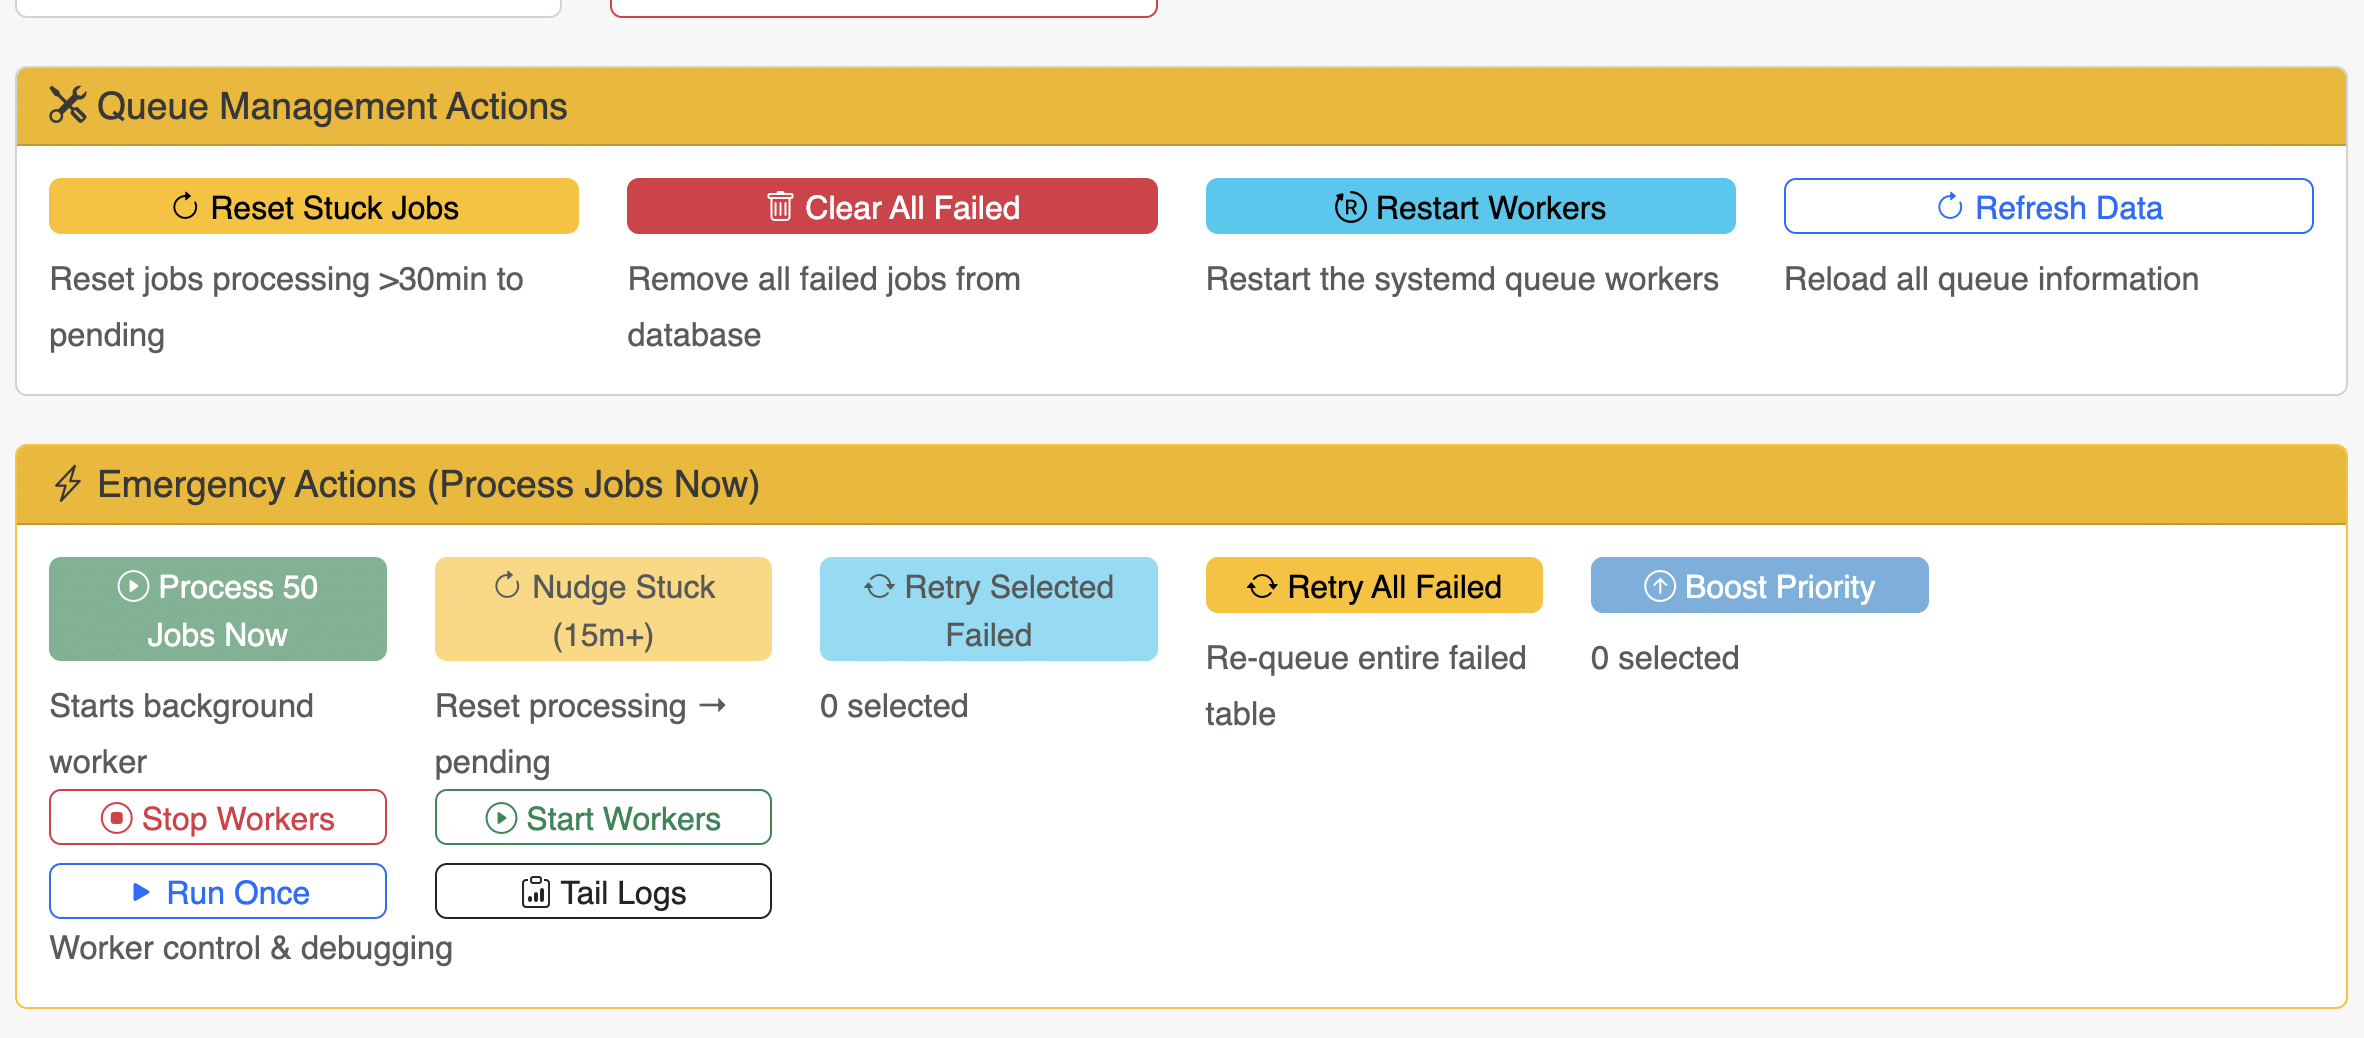
Beneath that, you’ll have access to queue management actions. Here, you can restart workers, clear failed workers, and reset stuck jobs. You can also retry failed tasks, nudge stuck workers to see whether they’ve frozen, and process up to fifty background jobs waiting to complete. At the bottom of the screen, you’ll find lists of failed, pending, and active jobs, along with debugging and development tools for advanced admins who work directly with ITAM developers.
Document Generation (DocGen)
Next is DocGen. DocGen is an important part of building compliance evidence. It allows examiners and portal users to take information entered in a form and generate documents for compliance reporting. End users work with DocGen directly within a form. When they select an entry from the primary navigation list, they’ll see the option to generate documents. From there, they just need to wait for the task to complete, then download the document from the form entry.
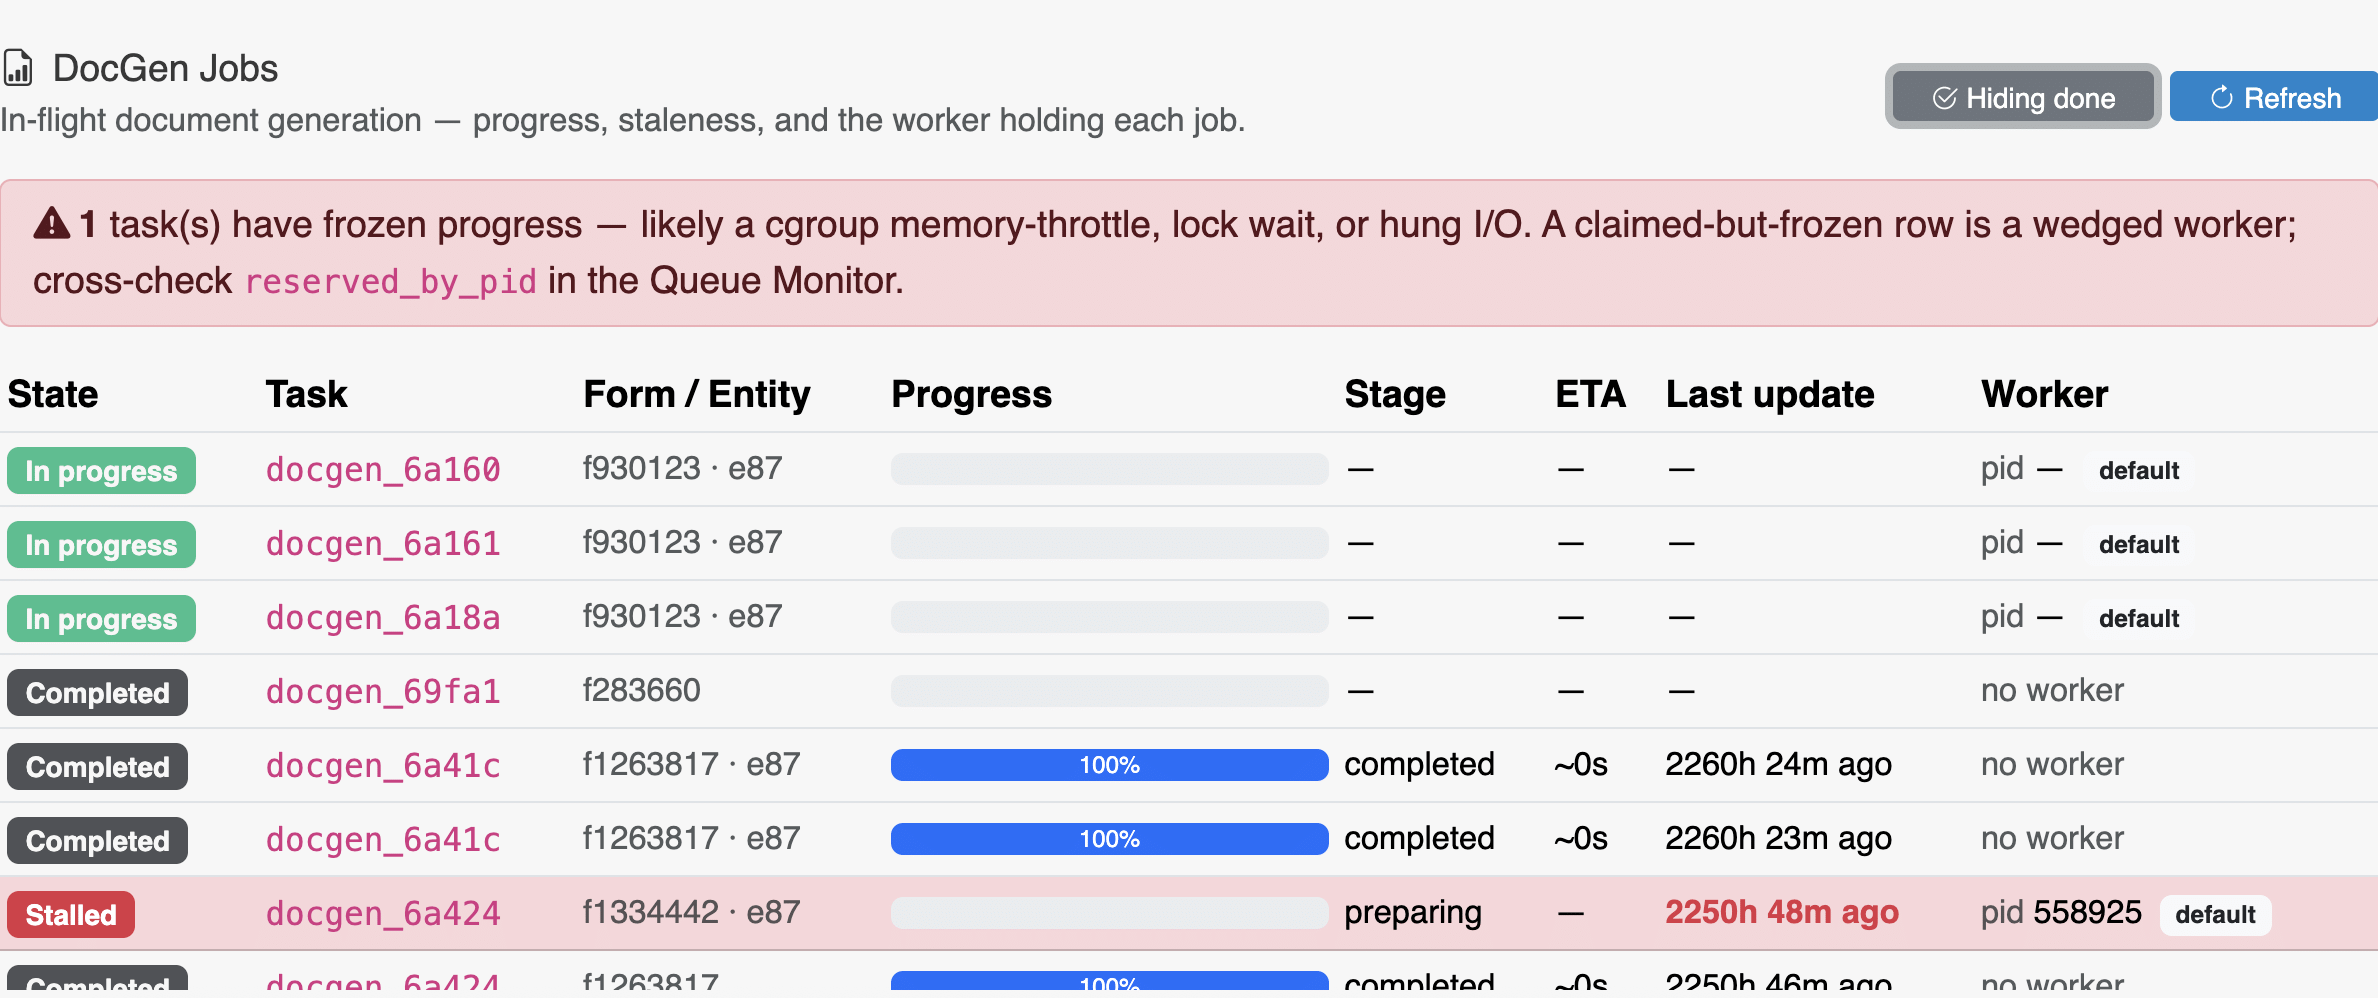
Administrators may need to track DocGen jobs when they stall or fail to complete. To do this, navigate to the DocGen Jobs tab in the DevOps section of your settings. Here, you’ll see an initial dashboard of all in-flight DocGen jobs, meaning those that are still running. Click Show Completed and Failed to see a list of jobs that have finished or failed, so you can troubleshoot issues.
Slow Queries
Next, Slow Queries. One of the more common bottlenecks that database and platform administrators run into is slow queries. Slow query logs are a unique type of database server log. They record queries that exceed an allotted execution time, and they serve as a crucial diagnostic for admins and developers who need to modify queries or database structures to improve performance.
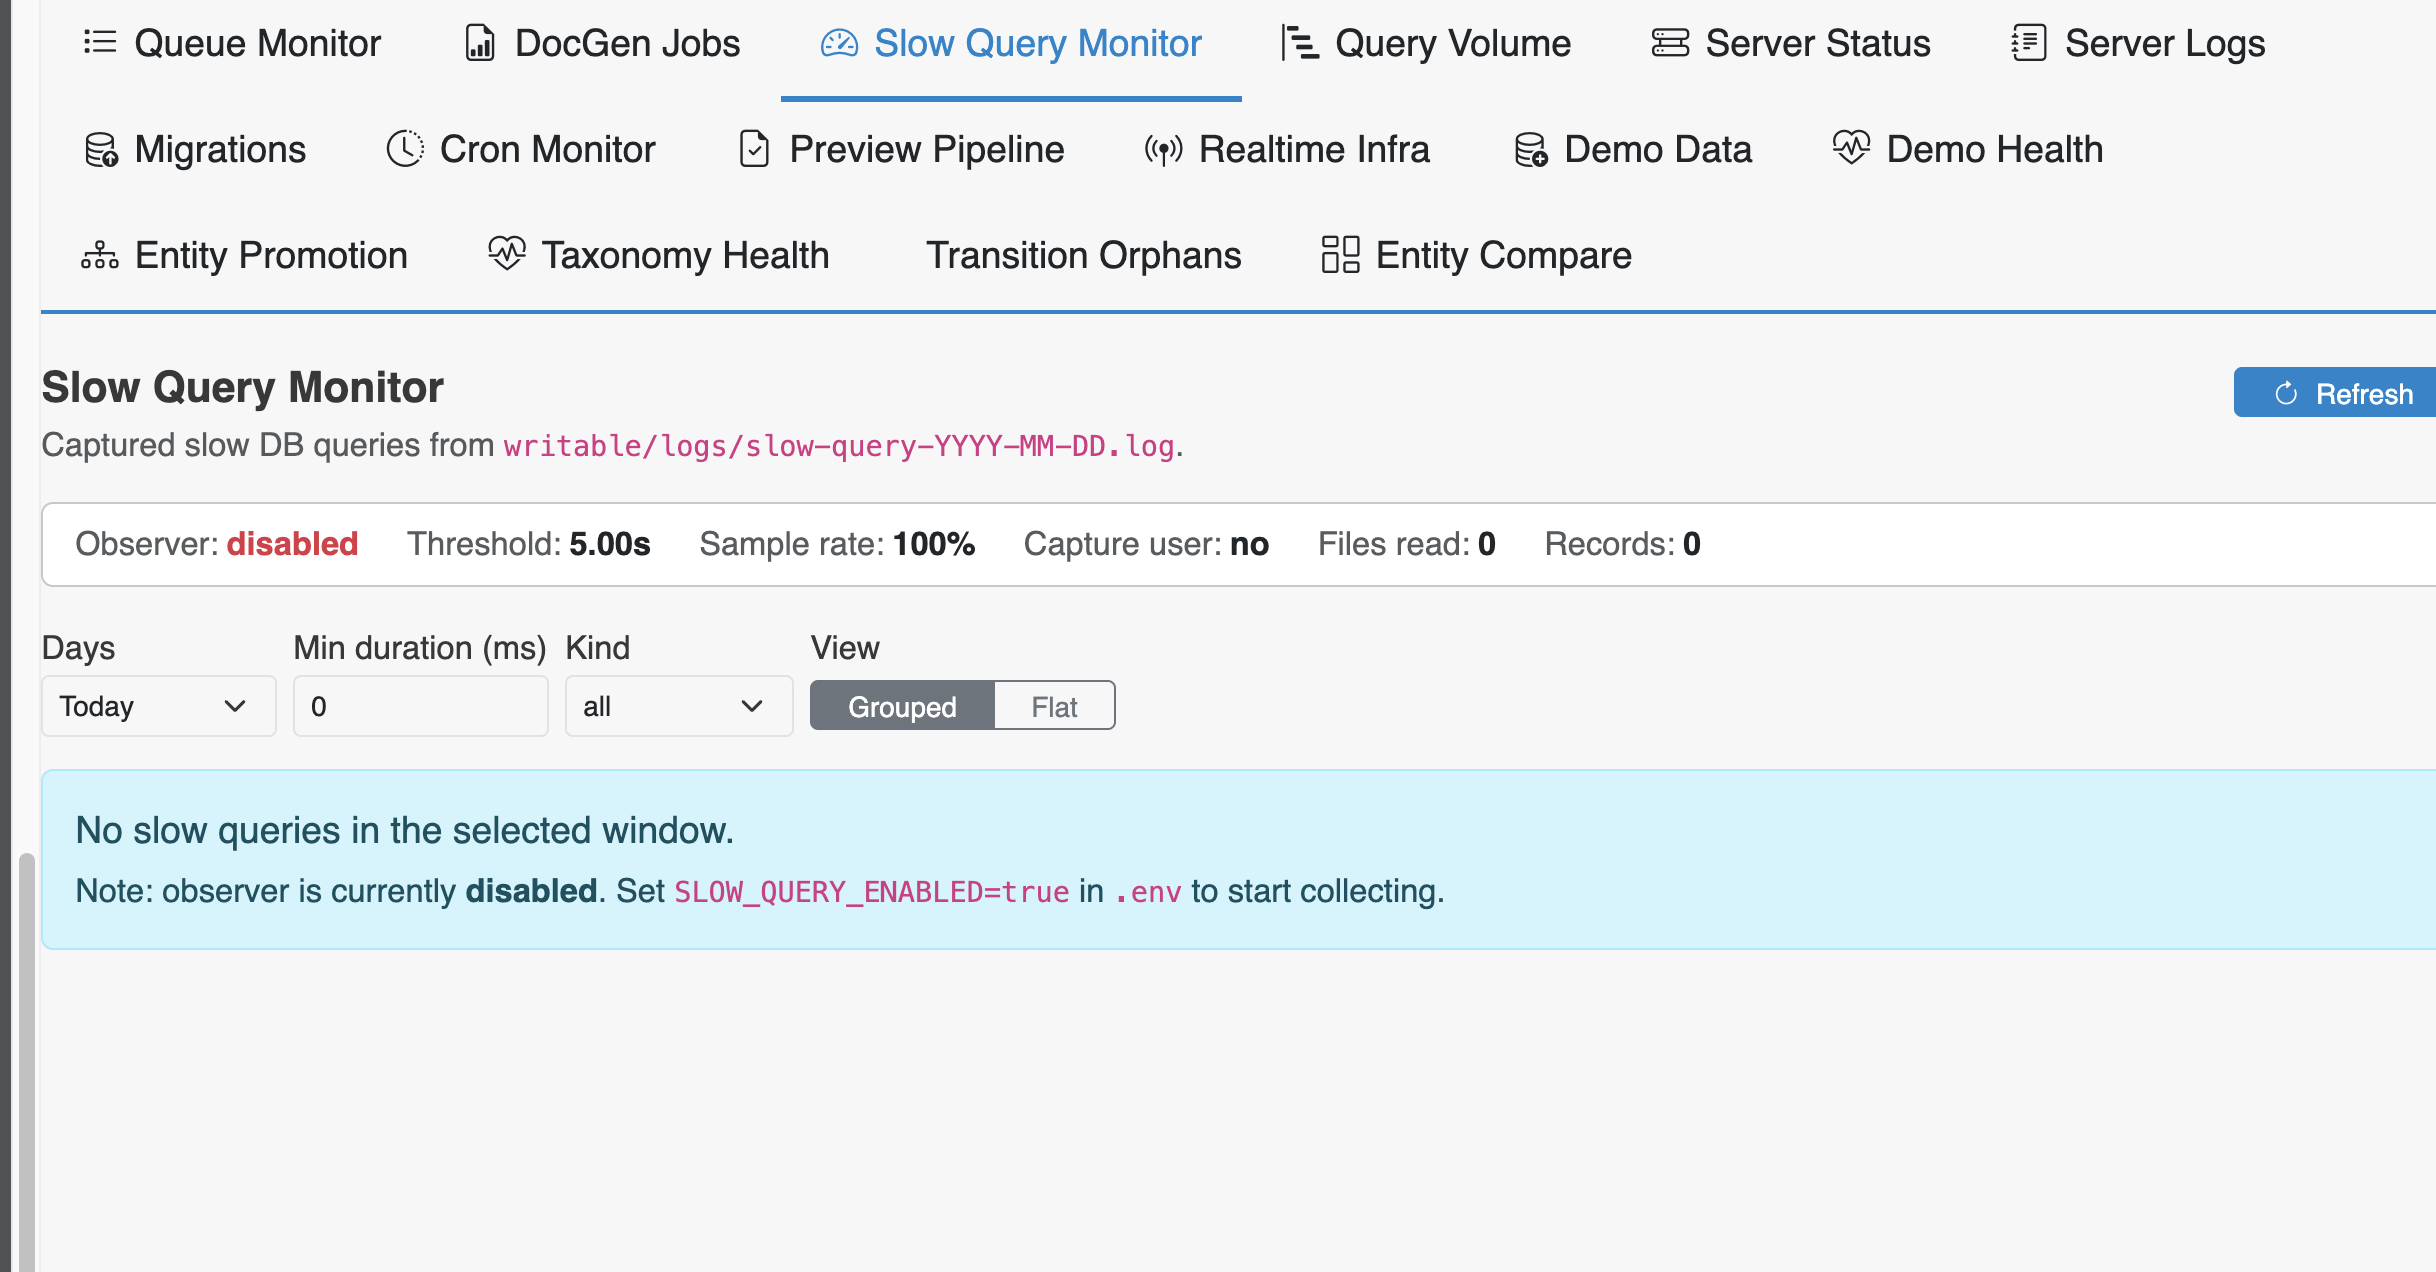
The Slow Queries dashboard is the tool you can use in ITAM for this purpose. Click the menu item to see an overview of slow queries across your ITAM virtual hosts. In this dashboard, you can look at slow query alerts for any period between one and seven days. You can also set a minimum execution time, in milliseconds, for the queries you want to see. Finally, you can organize the list by the remote or local servers you want to check, and by the type of query that was executed: read, write, schema, transaction, unknown, or all.
Cron Monitor
Next is Cron. Cron is a time-based job scheduler for Unix and Unix-like systems, and it plays a major role in the ITAM process management workflow. Developers and admins can define commands and recurring schedules so that maintenance, monitoring, or management tasks run automatically on a predetermined cadence.
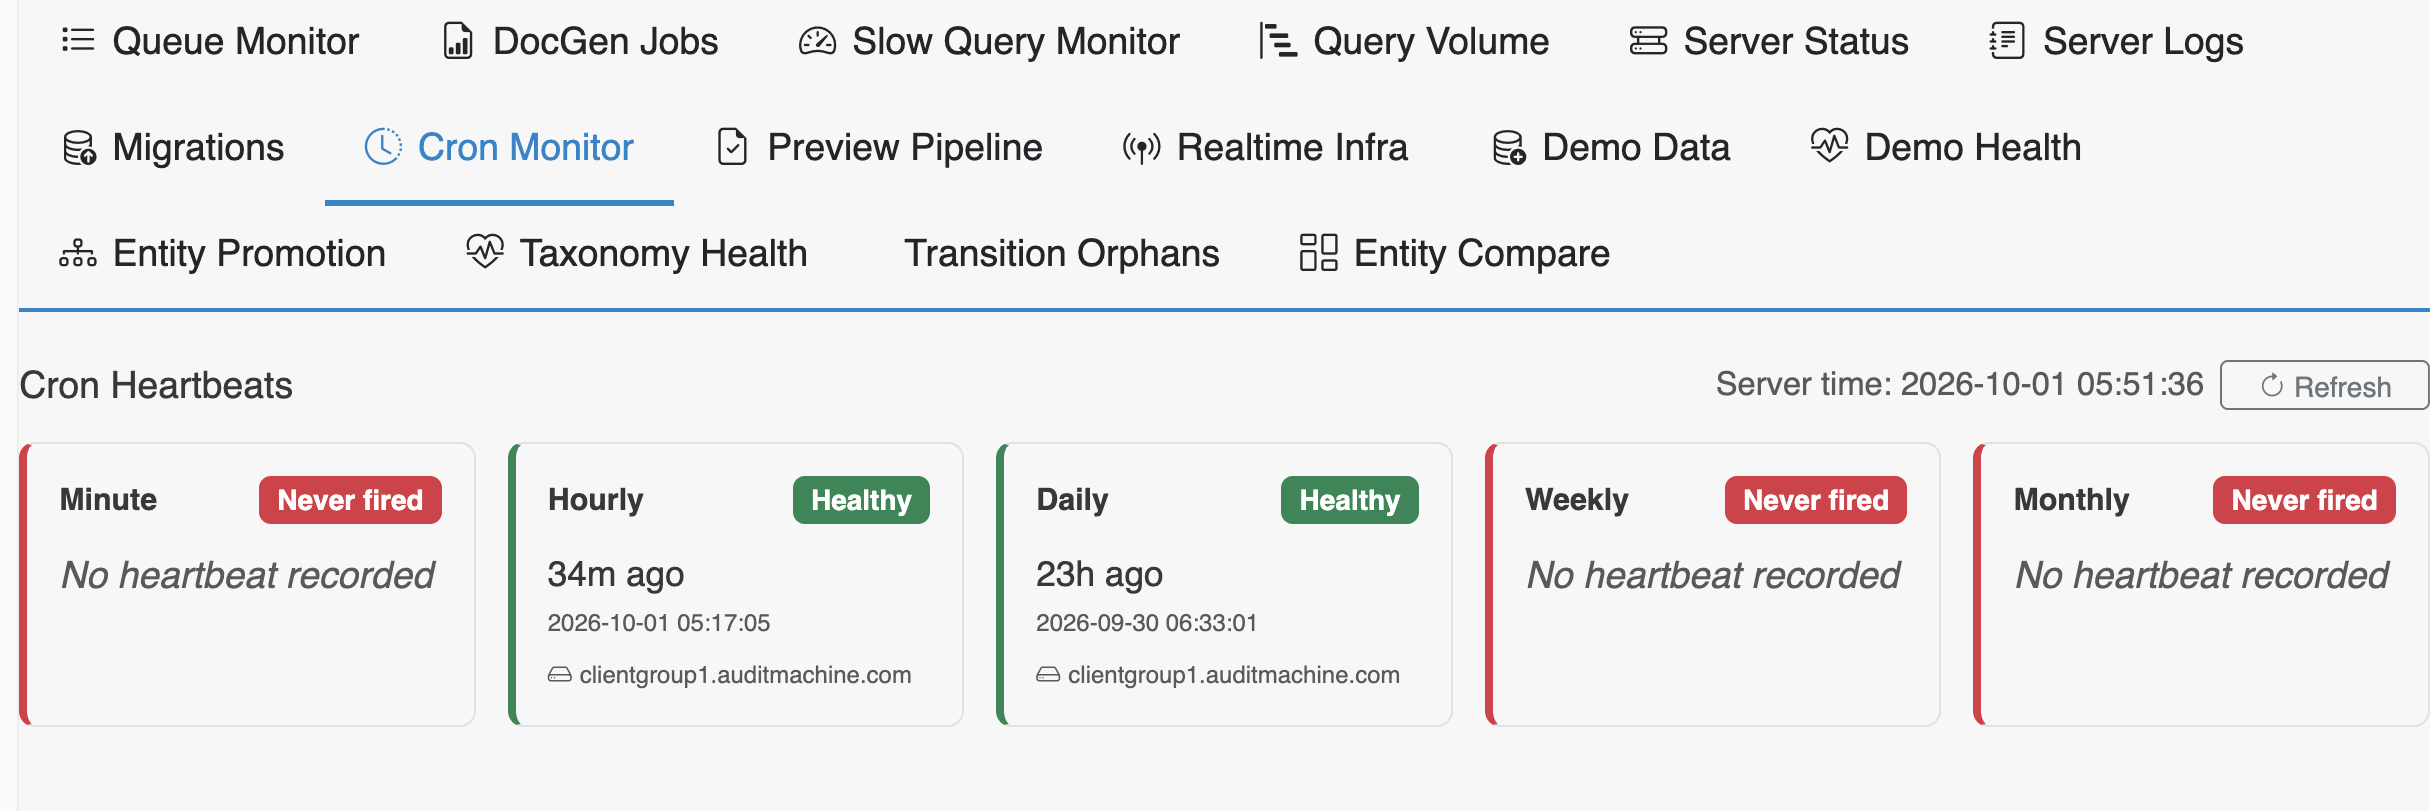
The Cron Monitor in Central Manager is an overview of the health of a cron scheduler in a remote ITAM instance. Health is measured by heartbeats, which occur when scheduled cron tasks fire. The list of heartbeats is broken into time chunks: minute, hour, day, week, and month. For each one, the monitor shows the last time a cron task scheduled for that window fired. From here, you can determine how long ago, if ever, a particular cron job ran, and decide whether there are any issues with your scheduled tasks.
Transition Orphans
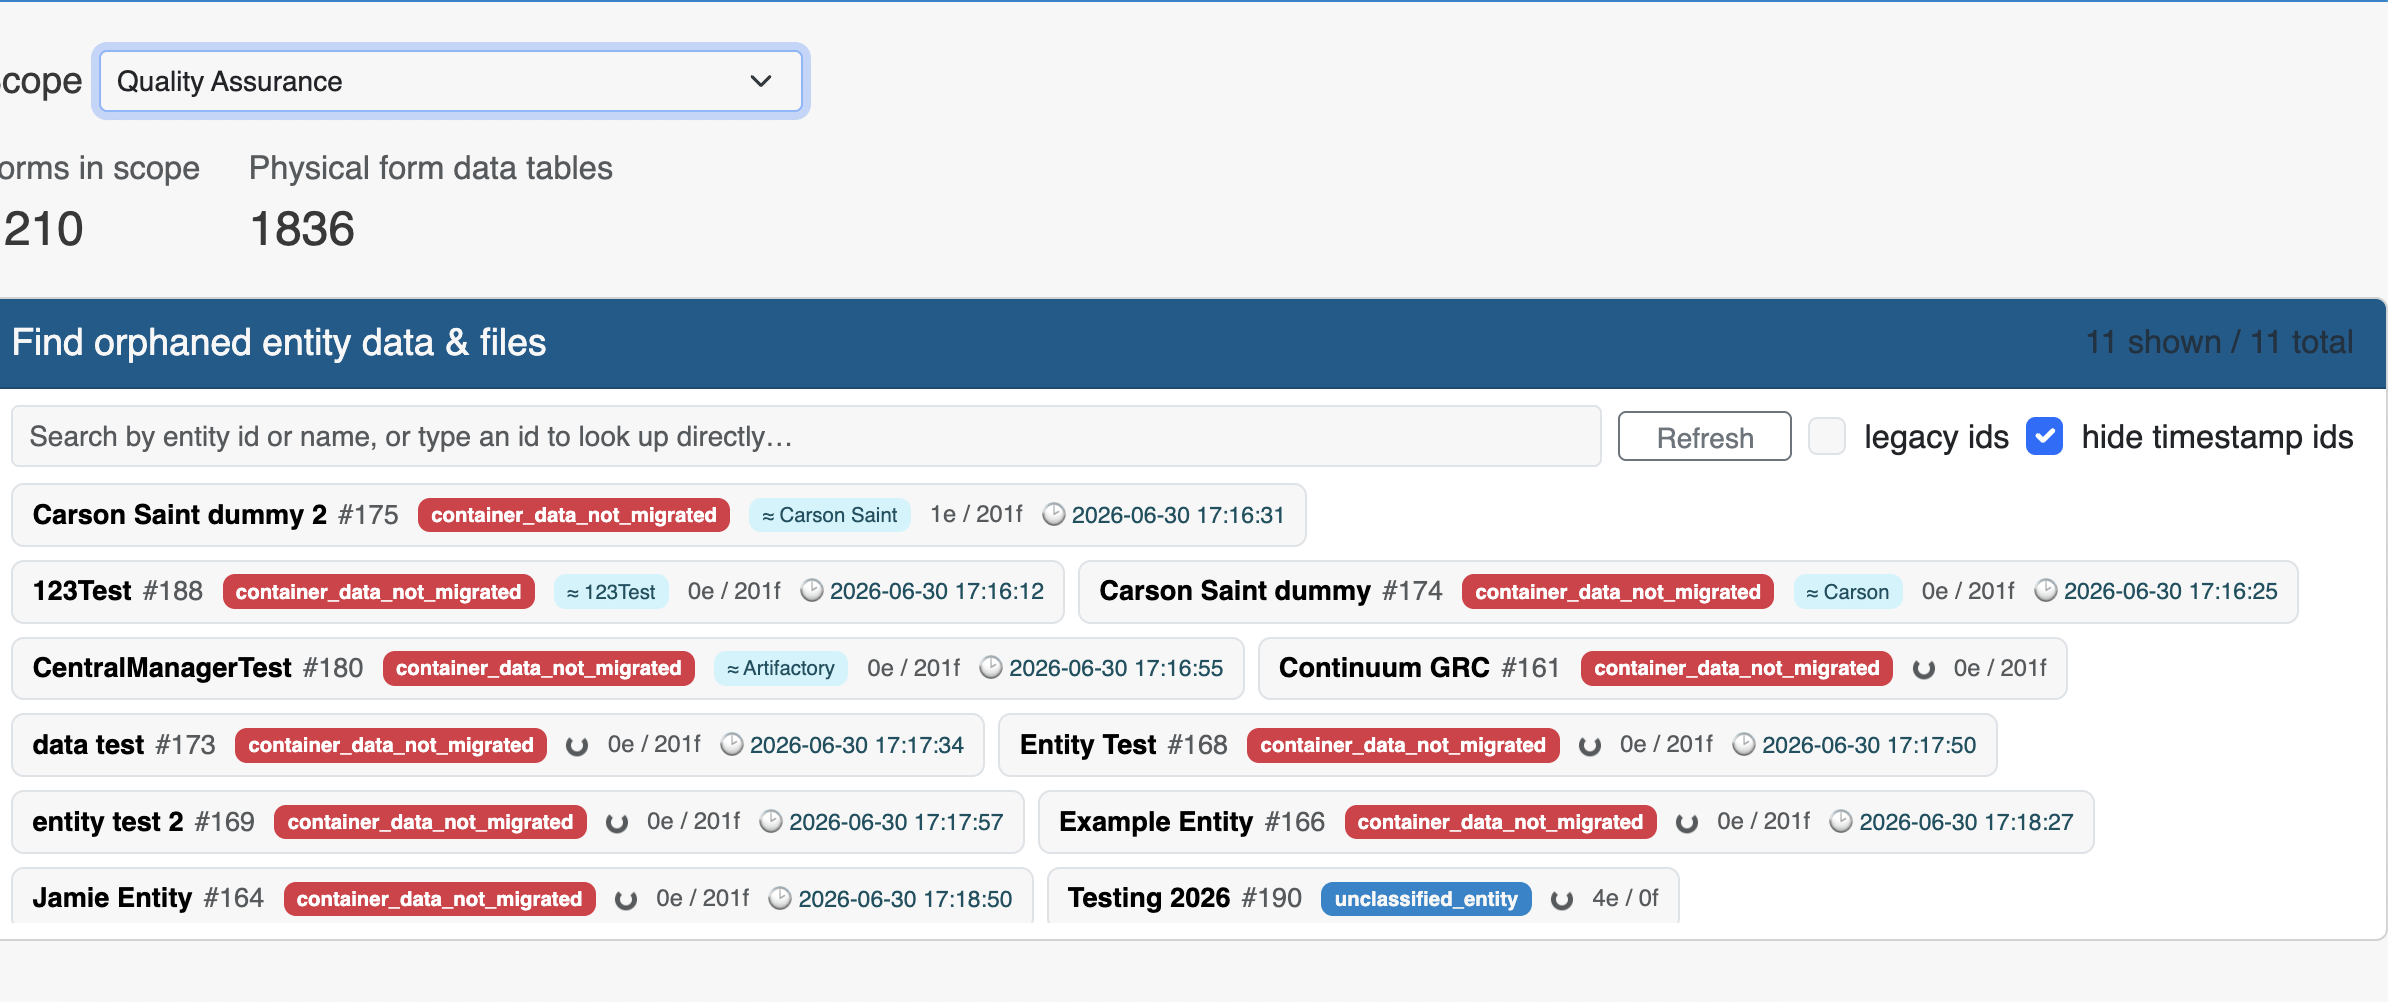
Orphan entires can prove a problem for most systems, leaving databases clogged with uneeded data and opening your organization up to compliance problems if the wrong data ends up in a vulnerable position. The Transition Orphans screen allows administrators to track these pieces of data:
Additional DevOps Telemetry
There are also several diagnostic and analytics-focused screens:
| Dashboard | Coverage |
|---|---|
| Server Status | This section covers the health and status of the server machine and the PHP server on your local ITAM. |
| Server Logs | As the name suggests, this is a collection of logs generated by your system, including audit logs, slow query logs, and others. |
| Migrations | These include changes to, and execution of, PHP code in the system. |
| Preview Pipeline | This section provides information about the workers that render .docx files to HTML and PDF. |
| Real-Time Infra | This section provides information on the Centrifugo and Redis packages, so you can assess the health of the ITAM messaging system. |